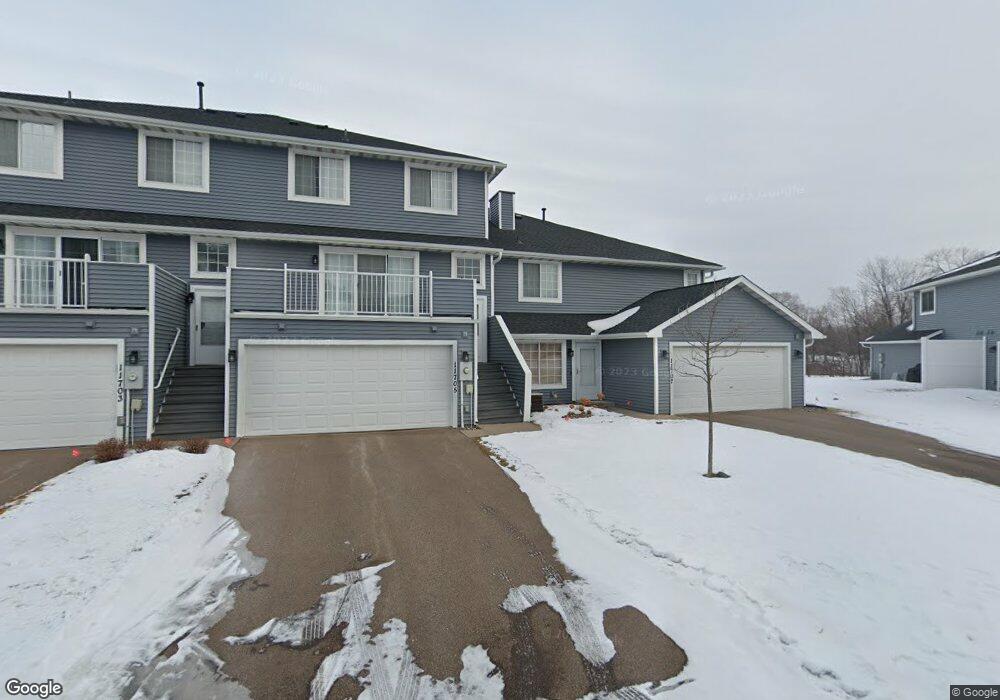
11683 Millpond Ave Burnsville, MN 55337
Estimated Value: $238,000 - $245,000
2
Beds
2
Baths
1,312
Sq Ft
$184/Sq Ft
Est. Value
About This Home
This home is located at 11683 Millpond Ave, Burnsville, MN 55337 and is currently estimated at $241,025, approximately $183 per square foot. 11683 Millpond Ave is a home located in Dakota County with nearby schools including Burnsville High School, Gateway STEM Academy, and Sunrise International Montessori School.
Ownership History
Date
Name
Owned For
Owner Type
Purchase Details
Closed on
Jul 16, 2025
Sold by
State Of Minnesota
Bought by
City Of Burnsville
Current Estimated Value
Purchase Details
Closed on
Jul 7, 2016
Sold by
Kurtz Amy E and Kurtz James
Bought by
Schoder David
Home Financials for this Owner
Home Financials are based on the most recent Mortgage that was taken out on this home.
Original Mortgage
$139,525
Interest Rate
3.6%
Mortgage Type
FHA
Purchase Details
Closed on
Mar 31, 2005
Sold by
Endeavor Holdings Llc
Bought by
Dvorak Amy E
Purchase Details
Closed on
Jan 4, 2005
Sold by
Northern Realty Ventures Llc
Bought by
Endeavor Holdings Llc
Purchase Details
Closed on
Aug 8, 1997
Sold by
Delta Development Inc
Bought by
Buchner Jon D
Create a Home Valuation Report for This Property
The Home Valuation Report is an in-depth analysis detailing your home's value as well as a comparison with similar homes in the area
Home Values in the Area
Average Home Value in this Area
Purchase History
| Date | Buyer | Sale Price | Title Company |
|---|---|---|---|
| City Of Burnsville | -- | None Listed On Document | |
| Schoder David | $142,100 | Home Title Inc | |
| Dvorak Amy E | $170,400 | -- | |
| Endeavor Holdings Llc | $133,000 | -- | |
| Buchner Jon D | $95,175 | -- | |
| Delta Development Inc | $5,000 | -- |
Source: Public Records
Mortgage History
| Date | Status | Borrower | Loan Amount |
|---|---|---|---|
| Previous Owner | Schoder David | $139,525 |
Source: Public Records
Tax History Compared to Growth
Tax History
| Year | Tax Paid | Tax Assessment Tax Assessment Total Assessment is a certain percentage of the fair market value that is determined by local assessors to be the total taxable value of land and additions on the property. | Land | Improvement |
|---|---|---|---|---|
| 2024 | $2,132 | $200,900 | $40,700 | $160,200 |
| 2023 | $2,132 | $216,400 | $40,800 | $175,600 |
| 2022 | $1,832 | $199,000 | $40,700 | $158,300 |
| 2021 | $1,734 | $186,800 | $35,400 | $151,400 |
| 2020 | $1,610 | $170,300 | $33,700 | $136,600 |
| 2019 | $1,599 | $155,100 | $32,100 | $123,000 |
| 2018 | $1,494 | $147,800 | $29,700 | $118,100 |
| 2017 | $1,434 | $136,200 | $27,500 | $108,700 |
| 2016 | $1,685 | $130,600 | $26,200 | $104,400 |
| 2015 | $1,512 | $123,600 | $25,400 | $98,200 |
| 2014 | -- | $115,900 | $23,900 | $92,000 |
| 2013 | -- | $78,518 | $15,674 | $62,844 |
Source: Public Records
Map
Nearby Homes
- 2200 Horizon Rd
- 11900 Highland View Cir
- 1853 Riverwood Dr Unit 4
- 1800 Riverwood Dr Unit 110
- 1800 Riverwood Dr Unit 323
- 3017 Mcleod St
- 11921 Baypoint Dr
- 11902 River Hills Cir
- 2329 Explorer Ct
- 11311 W River Hills Dr
- 2001 Woods Ln
- 1601 Raleigh Dr
- 1609 Riverwood Dr
- 2005 E 122nd St Unit A7
- 2005 E 122nd St Unit A14
- 2005 E 122nd St Unit A23
- 3309 Red Oak Cir N
- 2011 E 122nd St Unit D24
- 2009 E 122nd St Unit C8
- 12232 Oak Leaf Cir
- 11681 Millpond Ave Unit 57
- 11679 Millpond Ave
- 11677 Millpond Ave
- 11719 Millpond Ave
- 11701 Millpond Ave
- 11701 Millpond Ave Unit 62
- 11703 Millpond Ave Unit 61
- 11703 Millpond Ave
- 11705 Millpond Ave
- 11707 Millpond Ave
- 11721 Millpond Ave
- 11723 Millpond Ave Unit 75
- 11737 Millpond Ave
- 11735 Millpond Ave Unit 79
- 11725 Millpond Ave Unit 76
- 11667 Millpond Ave Unit 50
- 11733 Millpond Ave Unit 80
- 11685 Millpond Ave Unit 63
- 11687 Millpond Ave
- 11687 Millpond Ave Unit 64