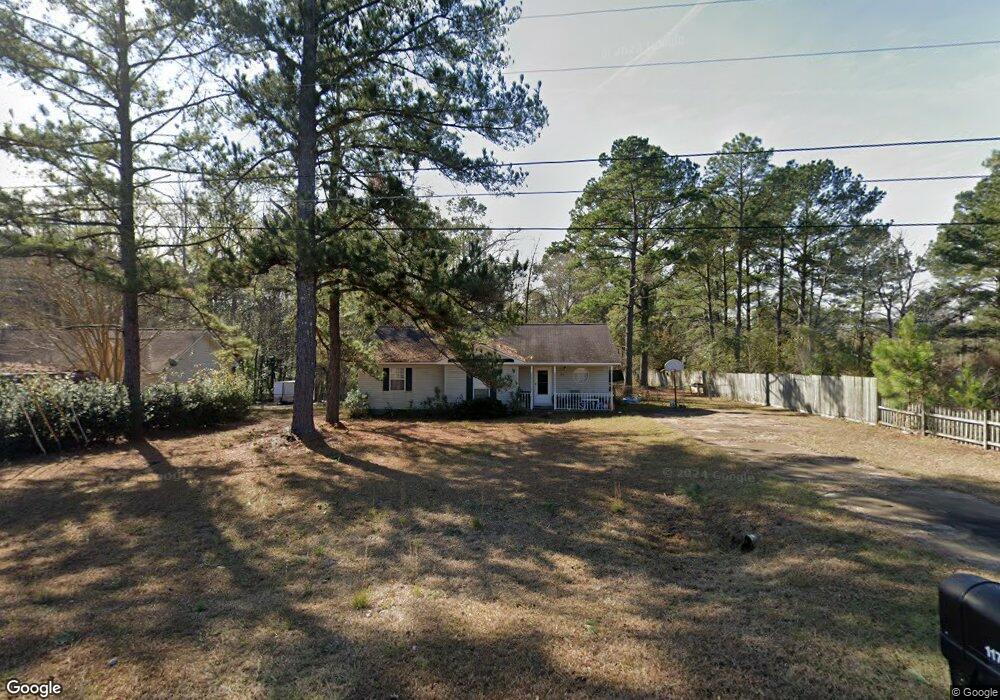
117 Spiral Rd Thomasville, GA 31757
Estimated Value: $219,000 - $246,000
3
Beds
2
Baths
1,430
Sq Ft
$164/Sq Ft
Est. Value
About This Home
This home is located at 117 Spiral Rd, Thomasville, GA 31757 and is currently estimated at $234,648, approximately $164 per square foot. 117 Spiral Rd is a home located in Thomas County with nearby schools including Hand in Hand Primary School, Cross Creek Elementary School, and Garrison-Pilcher Elementary School.
Ownership History
Date
Name
Owned For
Owner Type
Purchase Details
Closed on
May 17, 2016
Sold by
Thompson Kim A
Bought by
Thompson Tony D
Current Estimated Value
Purchase Details
Closed on
Sep 19, 2007
Sold by
Thompson Tony D
Bought by
Thompson Tony D and Thompson Kim A
Home Financials for this Owner
Home Financials are based on the most recent Mortgage that was taken out on this home.
Original Mortgage
$123,068
Interest Rate
6.49%
Mortgage Type
FHA
Purchase Details
Closed on
Sep 18, 2007
Sold by
Merritt Wesley A
Bought by
Thompson Tony D
Home Financials for this Owner
Home Financials are based on the most recent Mortgage that was taken out on this home.
Original Mortgage
$123,068
Interest Rate
6.49%
Mortgage Type
FHA
Purchase Details
Closed on
Oct 10, 2001
Sold by
Littlepage John A
Bought by
Merritt Wesley A
Purchase Details
Closed on
Mar 24, 1998
Bought by
Littlepage John A
Create a Home Valuation Report for This Property
The Home Valuation Report is an in-depth analysis detailing your home's value as well as a comparison with similar homes in the area
Home Values in the Area
Average Home Value in this Area
Purchase History
| Date | Buyer | Sale Price | Title Company |
|---|---|---|---|
| Thompson Tony D | -- | -- | |
| Thompson Tony D | -- | -- | |
| Thompson Tony D | $125,000 | -- | |
| Merritt Wesley A | $87,000 | -- | |
| Littlepage John A | $79,800 | -- |
Source: Public Records
Mortgage History
| Date | Status | Borrower | Loan Amount |
|---|---|---|---|
| Previous Owner | Thompson Tony D | $123,068 |
Source: Public Records
Tax History Compared to Growth
Tax History
| Year | Tax Paid | Tax Assessment Tax Assessment Total Assessment is a certain percentage of the fair market value that is determined by local assessors to be the total taxable value of land and additions on the property. | Land | Improvement |
|---|---|---|---|---|
| 2024 | $1,612 | $79,842 | $17,600 | $62,242 |
| 2023 | $1,440 | $73,164 | $16,000 | $57,164 |
| 2022 | $1,358 | $62,748 | $14,000 | $48,748 |
| 2021 | $1,226 | $51,741 | $14,000 | $37,741 |
| 2020 | $1,210 | $49,881 | $14,000 | $35,881 |
| 2019 | $1,223 | $49,881 | $14,000 | $35,881 |
| 2018 | $1,261 | $48,673 | $14,000 | $34,673 |
| 2017 | $1,227 | $46,641 | $12,460 | $34,181 |
| 2016 | $1,203 | $45,403 | $12,460 | $32,943 |
| 2015 | $1,175 | $43,655 | $11,620 | $32,035 |
| 2014 | $1,160 | $42,912 | $11,620 | $31,292 |
| 2013 | -- | $42,911 | $11,620 | $31,291 |
Source: Public Records
Map
Nearby Homes
- 106 Spiral Rd
- 250 Knoll Rd
- 00 Parcel # 053a313 West Shore Dr Lot 21
- 171 Longwood Dr
- 365 W Shore Dr
- 475 W Shore Dr
- 693 W Shore Dr
- 105 Mossy Creek Way
- 475 Longwood Dr
- 107 Mossy Creek Way
- 800 N Westshore Dr
- 800 Westshore Dr
- 8805 Georgia 202
- 10806 Georgia 202
- 900 Benton Rd
- 111 Willow Ridge Cir
- 108 Willow Ridge Cir
- 210 Egg & Butter Rd
- 210 Egg and Butter Rd N
- 154 Willow Ridge Cir