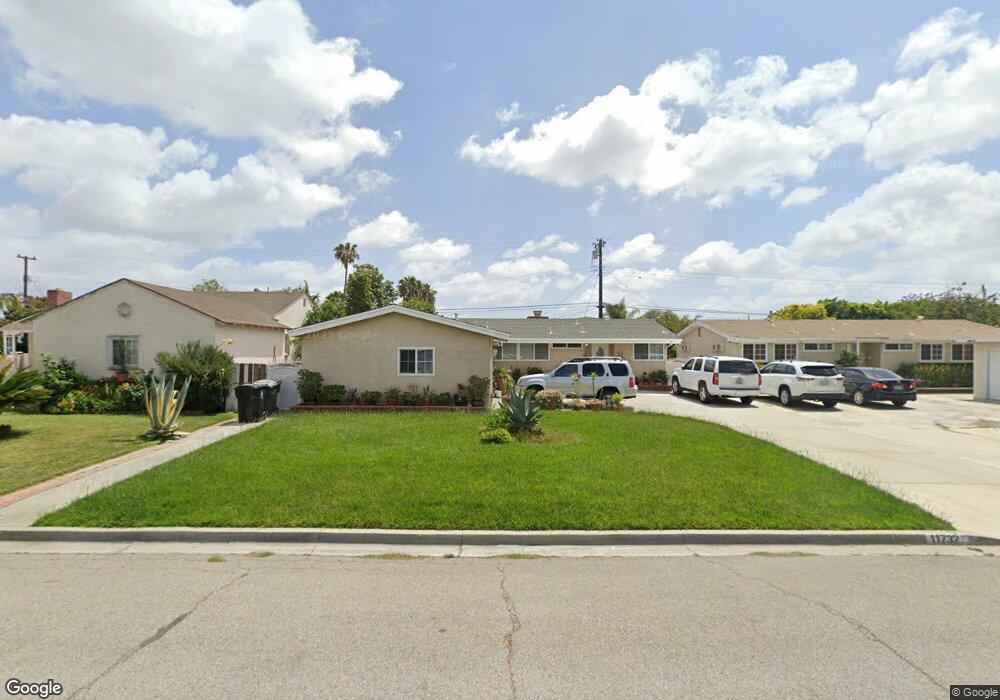
11732 John Ave Garden Grove, CA 92840
Estimated Value: $993,000 - $1,083,516
4
Beds
2
Baths
1,840
Sq Ft
$556/Sq Ft
Est. Value
About This Home
This home is located at 11732 John Ave, Garden Grove, CA 92840 and is currently estimated at $1,023,129, approximately $556 per square foot. 11732 John Ave is a home located in Orange County with nearby schools including Crosby Elementary School, Izaak Walton Intermediate School, and Garden Grove High School.
Ownership History
Date
Name
Owned For
Owner Type
Purchase Details
Closed on
Jun 21, 2002
Sold by
York Patrick B and York Karen Marie
Bought by
Aguzar Adonis and Aguzar Jennifer
Current Estimated Value
Home Financials for this Owner
Home Financials are based on the most recent Mortgage that was taken out on this home.
Original Mortgage
$238,400
Outstanding Balance
$99,945
Interest Rate
6.69%
Estimated Equity
$923,184
Purchase Details
Closed on
Feb 10, 1994
Sold by
Federal Home Loan Mortgage Corporation
Bought by
York Patrick B and York Karen Marie
Home Financials for this Owner
Home Financials are based on the most recent Mortgage that was taken out on this home.
Original Mortgage
$143,560
Interest Rate
7.09%
Purchase Details
Closed on
Nov 19, 1993
Sold by
Countrywide Title Corp
Bought by
Countrywide Funding Corp
Create a Home Valuation Report for This Property
The Home Valuation Report is an in-depth analysis detailing your home's value as well as a comparison with similar homes in the area
Home Values in the Area
Average Home Value in this Area
Purchase History
| Date | Buyer | Sale Price | Title Company |
|---|---|---|---|
| Aguzar Adonis | $298,000 | Southland Title Corporation | |
| York Patrick B | $148,000 | Gateway Title Company | |
| Countrywide Funding Corp | $170,000 | Countrywide Title Corporatio |
Source: Public Records
Mortgage History
| Date | Status | Borrower | Loan Amount |
|---|---|---|---|
| Open | Aguzar Adonis | $238,400 | |
| Previous Owner | York Patrick B | $143,560 |
Source: Public Records
Tax History Compared to Growth
Tax History
| Year | Tax Paid | Tax Assessment Tax Assessment Total Assessment is a certain percentage of the fair market value that is determined by local assessors to be the total taxable value of land and additions on the property. | Land | Improvement |
|---|---|---|---|---|
| 2025 | $6,160 | $489,359 | $349,300 | $140,059 |
| 2024 | $6,160 | $479,764 | $342,451 | $137,313 |
| 2023 | $6,048 | $470,357 | $335,736 | $134,621 |
| 2022 | $5,914 | $461,135 | $329,153 | $131,982 |
| 2021 | $5,832 | $452,094 | $322,699 | $129,395 |
| 2020 | $5,763 | $447,459 | $319,390 | $128,069 |
| 2019 | $5,685 | $438,686 | $313,128 | $125,558 |
| 2018 | $5,547 | $430,085 | $306,988 | $123,097 |
| 2017 | $5,490 | $421,652 | $300,968 | $120,684 |
| 2016 | $5,216 | $413,385 | $295,067 | $118,318 |
| 2015 | $5,148 | $407,176 | $290,635 | $116,541 |
| 2014 | $5,029 | $399,200 | $284,941 | $114,259 |
Source: Public Records
Map
Nearby Homes
- 11731 Rose Dr
- 405 13181 Lampson
- 11841 Shetland Rd
- 12246 Nadine Cir
- 11252 Chapman Ave
- 12662 Woodland Ln
- 11531 Kathy Ln
- 11552 9th St
- 11531 West St
- 12677 8th St
- 12727 West St
- 2227 S Atlanta St
- 12222 Emrys Ave
- 11102 Avolencia Place
- 12851 Newhope St
- 11401 Kathy Ln
- 11081 Iris Dr
- 11402 Morgan Ln
- 12861 West St Unit 157
- 12861 West St Unit 100
- 11722 John Ave
- 11742 John Ave
- 11752 John Ave
- 11712 John Ave
- 11731 Brookshire Ave
- 11721 Brookshire Ave
- 11741 Brookshire Ave
- 12092 Jennifer Ln
- 11711 Brookshire Ave
- 11751 Brookshire Ave
- 11702 John Ave
- 11762 John Ave
- 12091 Jacalene Ln
- 11701 Brookshire Ave
- 12082 Jennifer Ln
- 11761 Brookshire Ave
- 12091 Jennifer Ln
- 11692 John Ave
- 11782 John Ave
- 12081 Jacalene Ln