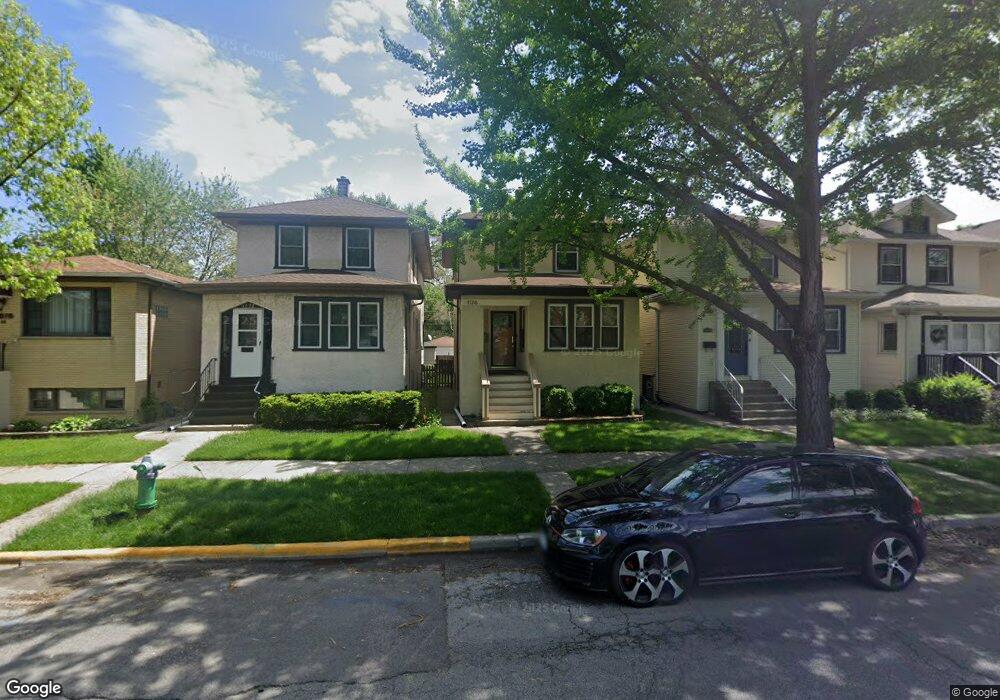
1174 S East Ave Oak Park, IL 60304
Estimated Value: $386,000 - $482,000
3
Beds
2
Baths
1,236
Sq Ft
$352/Sq Ft
Est. Value
About This Home
This home is located at 1174 S East Ave, Oak Park, IL 60304 and is currently estimated at $435,631, approximately $352 per square foot. 1174 S East Ave is a home located in Cook County with nearby schools including Percy Julian Middle School, Oak Park and River Forest High School, and West Suburban Montessori School.
Create a Home Valuation Report for This Property
The Home Valuation Report is an in-depth analysis detailing your home's value as well as a comparison with similar homes in the area
Home Values in the Area
Average Home Value in this Area
Tax History Compared to Growth
Tax History
| Year | Tax Paid | Tax Assessment Tax Assessment Total Assessment is a certain percentage of the fair market value that is determined by local assessors to be the total taxable value of land and additions on the property. | Land | Improvement |
|---|---|---|---|---|
| 2024 | $10,329 | $32,677 | $4,410 | $28,267 |
| 2023 | $11,599 | $35,000 | $4,410 | $30,590 |
| 2022 | $11,599 | $33,627 | $3,308 | $30,319 |
| 2021 | $11,336 | $33,625 | $3,307 | $30,318 |
| 2020 | $11,142 | $33,625 | $3,307 | $30,318 |
| 2019 | $11,238 | $32,721 | $2,992 | $29,729 |
| 2018 | $10,815 | $32,721 | $2,992 | $29,729 |
| 2017 | $10,599 | $32,721 | $2,992 | $29,729 |
| 2016 | $9,435 | $25,940 | $2,520 | $23,420 |
| 2015 | $8,409 | $25,940 | $2,520 | $23,420 |
| 2014 | $7,832 | $25,940 | $2,520 | $23,420 |
| 2013 | $8,901 | $29,981 | $2,520 | $27,461 |
Source: Public Records
Map
Nearby Homes
- 1183 S Scoville Ave
- 1156 Wesley Ave
- 1125 Gunderson Ave
- 1223 S Elmwood Ave Unit TWO
- 1133 S Ridgeland Ave
- 1321 East Ave
- 1243 Elmwood Ave
- 6337 Roosevelt Rd Unit 309
- 6337 Roosevelt Rd Unit 103
- 1135 S Oak Park Ave
- 1335 Wesley Ave
- 1141 Highland Ave
- 1336 Cuyler Ave
- 924 Wesley Ave Unit 2
- 920 Wesley Ave Unit 1
- 1101 S Oak Park Ave
- 1435 Gunderson Ave
- 1036 Highland Ave
- 1140 S Harvey Ave
- 915 S Oak Park Ave Unit 1-B
- 1172 S East Ave
- 1176 S East Ave
- 1170 S East Ave
- 1178 S East Ave
- 1180 S East Ave
- 1166 S East Ave
- 1182 S East Ave
- 1164 S East Ave
- 1173 S Scoville Ave
- 1177 S Scoville Ave
- 1171 S Scoville Ave
- 1179 S Scoville Ave
- 1162 S East Ave
- 1169 S Scoville Ave
- 1181 S Scoville Ave
- 1167 S Scoville Ave
- 1165 S Scoville Ave
- 1185 S Scoville Ave
- 1177 S East Ave
- 1179 S East Ave