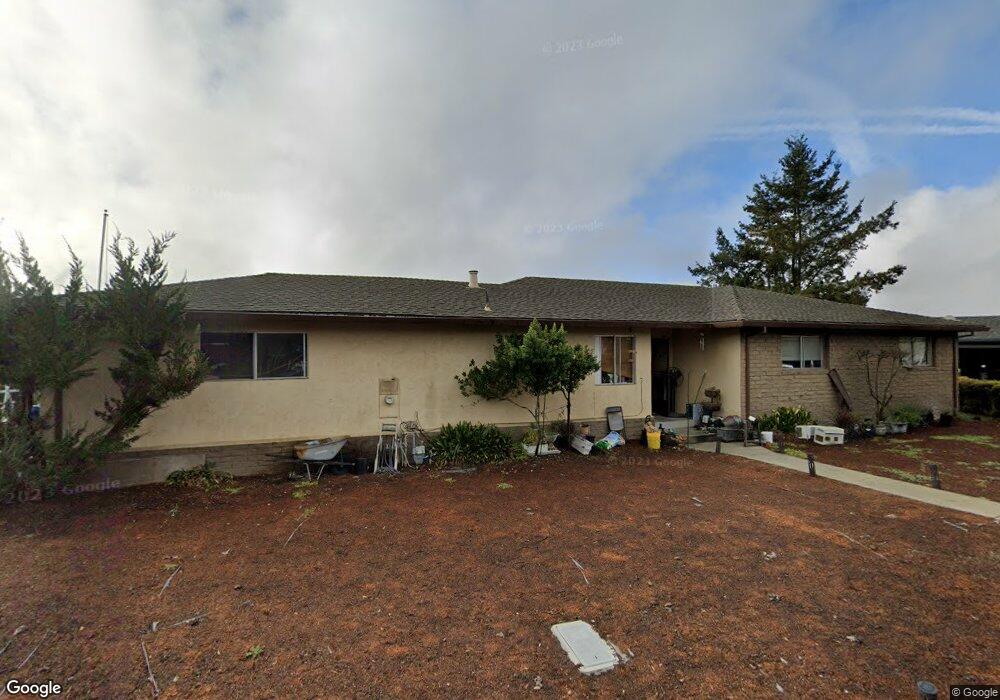
118 Belair Ct Scotts Valley, CA 95066
Estimated Value: $1,170,172 - $1,363,000
3
Beds
2
Baths
1,777
Sq Ft
$721/Sq Ft
Est. Value
About This Home
This home is located at 118 Belair Ct, Scotts Valley, CA 95066 and is currently estimated at $1,281,543, approximately $721 per square foot. 118 Belair Ct is a home located in Santa Cruz County with nearby schools including Vine Hill Elementary School, Scotts Valley Middle School, and Scotts Valley High School.
Ownership History
Date
Name
Owned For
Owner Type
Purchase Details
Closed on
Jan 26, 2011
Sold by
Lopez Reginald E and Lopez Peggie L
Bought by
Lopez Reginald E and Lopez Peggie L
Current Estimated Value
Home Financials for this Owner
Home Financials are based on the most recent Mortgage that was taken out on this home.
Original Mortgage
$938,250
Outstanding Balance
$642,327
Interest Rate
4.79%
Mortgage Type
Reverse Mortgage Home Equity Conversion Mortgage
Estimated Equity
$639,216
Purchase Details
Closed on
Apr 22, 2010
Sold by
Lopez Reginald E and Lopez Peggie L
Bought by
Lopez Reginald E
Home Financials for this Owner
Home Financials are based on the most recent Mortgage that was taken out on this home.
Original Mortgage
$938,250
Interest Rate
4.92%
Mortgage Type
Reverse Mortgage Home Equity Conversion Mortgage
Purchase Details
Closed on
Jun 20, 1994
Sold by
Lopez Reginald Ed
Bought by
Lopez Reginald Ed
Create a Home Valuation Report for This Property
The Home Valuation Report is an in-depth analysis detailing your home's value as well as a comparison with similar homes in the area
Home Values in the Area
Average Home Value in this Area
Purchase History
| Date | Buyer | Sale Price | Title Company |
|---|---|---|---|
| Lopez Reginald E | -- | Orange Coast Title | |
| Lopez Reginald E | -- | Orange Coast Title | |
| Lopez Reginald Ed | -- | -- |
Source: Public Records
Mortgage History
| Date | Status | Borrower | Loan Amount |
|---|---|---|---|
| Open | Lopez Reginald E | $938,250 | |
| Closed | Lopez Reginald E | $938,250 |
Source: Public Records
Tax History Compared to Growth
Tax History
| Year | Tax Paid | Tax Assessment Tax Assessment Total Assessment is a certain percentage of the fair market value that is determined by local assessors to be the total taxable value of land and additions on the property. | Land | Improvement |
|---|---|---|---|---|
| 2025 | $2,045 | $110,829 | $32,315 | $78,514 |
| 2023 | $1,966 | $106,525 | $31,060 | $75,465 |
| 2022 | $1,887 | $104,436 | $30,451 | $73,985 |
| 2021 | $1,811 | $102,388 | $29,854 | $72,534 |
| 2020 | $1,754 | $101,339 | $29,548 | $71,791 |
| 2019 | $1,844 | $99,351 | $28,968 | $70,383 |
| 2018 | $1,626 | $97,403 | $28,400 | $69,003 |
| 2017 | $1,548 | $95,493 | $27,844 | $67,649 |
| 2016 | $1,460 | $93,621 | $27,298 | $66,323 |
| 2015 | $1,418 | $92,215 | $26,888 | $65,327 |
| 2014 | $1,400 | $90,408 | $26,361 | $64,047 |
Source: Public Records
Map
Nearby Homes
- 317 Sherman Dr
- 2907 Granite Creek Rd
- 0 Sherman Dr Unit ML82011948
- 112 Sunset Terrace
- 215 1/2 N Navarra Dr
- 228 N Navarra Dr
- 296 Grace Way
- 6011 Scotts Valley Dr Unit 6
- 6011 Scotts Valley Dr Unit 15
- 347 Skyforest Way
- 339 Skyforest Way
- 60 Highgate Rd
- 70 Highgate Rd
- 14 Sageland Ct
- 560 Hacienda Dr
- 40 Cathy Ln
- 108 Kent Ct
- 0 Santa Cruz Hwy
- 360 Tabor Dr
- 430 Tabor Dr