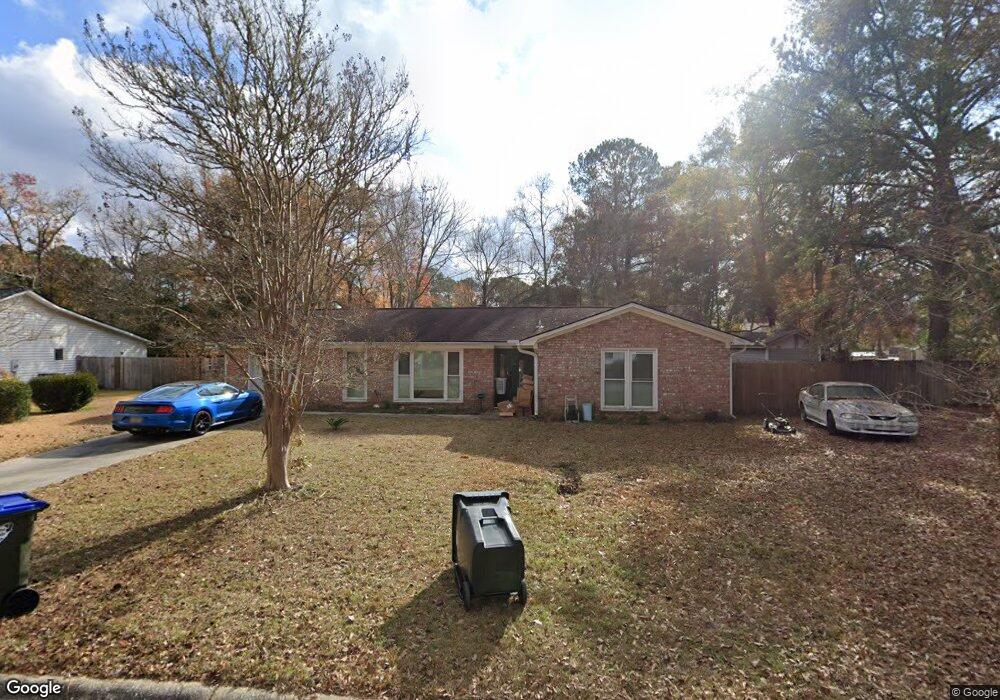
118 Heritage Ln Summerville, SC 29483
Estimated Value: $248,000 - $293,706
3
Beds
2
Baths
1,442
Sq Ft
$192/Sq Ft
Est. Value
About This Home
This home is located at 118 Heritage Ln, Summerville, SC 29483 and is currently estimated at $276,177, approximately $191 per square foot. 118 Heritage Ln is a home located in Dorchester County with nearby schools including Newington Elementary School, Charles B. DuBose Middle School, and Summerville High School.
Ownership History
Date
Name
Owned For
Owner Type
Purchase Details
Closed on
May 21, 2010
Sold by
Secretary Of Housing & Urban Development
Bought by
Prine Ii William L
Current Estimated Value
Purchase Details
Closed on
Aug 31, 2009
Sold by
Bac Home Loans Servicing Lp
Bought by
The Secretary Of Housing & Urban Develop
Purchase Details
Closed on
Jul 24, 2009
Sold by
Goodwin Roger Parker and Goodwin Donna Jean
Bought by
The Secretary Of Housing & Urban Develop
Purchase Details
Closed on
Jan 30, 2009
Sold by
Secretary Of Housing & Urban Development
Bought by
Countrywide Home Loans Inc
Purchase Details
Closed on
Mar 1, 2005
Sold by
Creedmore Russell D and Creedmore April Marie
Bought by
Hud
Purchase Details
Closed on
Jul 24, 2002
Sold by
Goodwin Roger Parker and Goodwin Donna Jean
Bought by
Creedmore Russell D
Purchase Details
Closed on
Nov 7, 2000
Sold by
Elbert Parrish and Elbert Maria C
Bought by
Goodwin Roger Parker and Goodwin Donna Jean
Create a Home Valuation Report for This Property
The Home Valuation Report is an in-depth analysis detailing your home's value as well as a comparison with similar homes in the area
Home Values in the Area
Average Home Value in this Area
Purchase History
| Date | Buyer | Sale Price | Title Company |
|---|---|---|---|
| Prine Ii William L | $88,000 | -- | |
| The Secretary Of Housing & Urban Develop | -- | -- | |
| The Secretary Of Housing & Urban Develop | -- | -- | |
| Countrywide Home Loans Inc | -- | -- | |
| Hud | $113,046 | -- | |
| Creedmore Russell D | $105,000 | -- | |
| Goodwin Roger Parker | $103,000 | -- |
Source: Public Records
Tax History Compared to Growth
Tax History
| Year | Tax Paid | Tax Assessment Tax Assessment Total Assessment is a certain percentage of the fair market value that is determined by local assessors to be the total taxable value of land and additions on the property. | Land | Improvement |
|---|---|---|---|---|
| 2025 | $1,344 | $11,643 | $3,200 | $8,443 |
| 2024 | $1,344 | $11,643 | $3,200 | $8,443 |
| 2023 | $1,344 | $5,711 | $1,400 | $4,311 |
| 2022 | $1,050 | $4,080 | $1,610 | $2,470 |
| 2021 | $1,169 | $4,080 | $1,610 | $2,470 |
| 2020 | $1,062 | $3,550 | $1,400 | $2,150 |
| 2019 | $1,040 | $3,550 | $1,400 | $2,150 |
| 2018 | $914 | $3,550 | $1,400 | $2,150 |
| 2017 | $898 | $3,550 | $1,400 | $2,150 |
| 2016 | $878 | $3,550 | $1,400 | $2,150 |
| 2015 | $879 | $3,550 | $1,400 | $2,150 |
| 2014 | $1,084 | $117,500 | $0 | $0 |
| 2013 | -- | $4,700 | $0 | $0 |
Source: Public Records
Map
Nearby Homes
- 126 Canaberry Cir
- 103 Blue Bonnet St
- 212 Angelica Ave
- 117 Blue Bonnet St
- 114 Ford Ct
- 72 Crossandra Ave
- 107 Foxglove Ave
- 403 Logan Dr
- 111 Foxglove Ave
- 81 Crossandra Ave
- 235 Jasmine Dr
- 104 Crossandra Ave
- 300 Foxglove Ave
- 96 Four Iron Ct
- 103 Four Iron Dr
- 117 Rosa St
- 122 Five Iron Cir
- 218 Trillium Ave
- 00 Wilson Dr
- 129 Guilford Dr
- 116 Heritage Ln
- 105 Bradd St
- 103 Bradd St
- 125 Canaberry Cir
- 123 Canaberry Cir
- 127 Canaberry Cir
- 114 Heritage Ln
- 119 Heritage Ln
- 121 Canaberry Cir
- 117 Heritage Ln
- 129 Canaberry Cir
- 101 Bradd St
- 112 Heritage Ln
- 119 Canaberry Cir
- 115 Heritage Ln
- 112 Heritage Ln
- 109 Bradd St
- 104 Bradd St
- 102 Bradd St
- 113 Heritage Ln