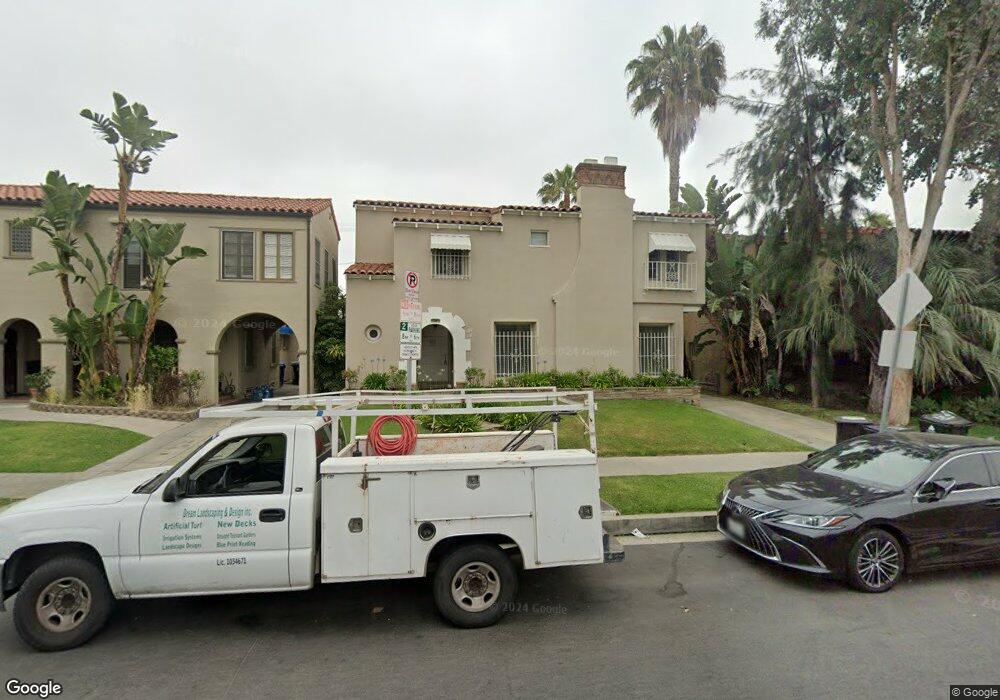
118 N Detroit St Los Angeles, CA 90036
Melrose NeighborhoodEstimated Value: $2,219,000 - $2,880,717
6
Beds
4
Baths
4,764
Sq Ft
$532/Sq Ft
Est. Value
About This Home
This home is located at 118 N Detroit St, Los Angeles, CA 90036 and is currently estimated at $2,534,179, approximately $531 per square foot. 118 N Detroit St is a home located in Los Angeles County with nearby schools including Third Street Elementary School, John Burroughs Middle School, and Fairfax High School.
Ownership History
Date
Name
Owned For
Owner Type
Purchase Details
Closed on
May 8, 2012
Sold by
118 No Detroit Llc
Bought by
Katz Jason and Katz Tammy
Current Estimated Value
Home Financials for this Owner
Home Financials are based on the most recent Mortgage that was taken out on this home.
Original Mortgage
$882,400
Outstanding Balance
$592,411
Interest Rate
3.25%
Mortgage Type
New Conventional
Estimated Equity
$1,941,768
Purchase Details
Closed on
Feb 21, 2012
Sold by
Bernstein Rita Linda
Bought by
118 No Detroit Llc
Purchase Details
Closed on
Sep 29, 2000
Sold by
Strazynski Nancy
Bought by
Bernstein Saul
Home Financials for this Owner
Home Financials are based on the most recent Mortgage that was taken out on this home.
Original Mortgage
$568,750
Interest Rate
7.96%
Mortgage Type
Stand Alone First
Purchase Details
Closed on
Aug 19, 1999
Sold by
Strazynski Josef
Bought by
Strazynski Nancy
Create a Home Valuation Report for This Property
The Home Valuation Report is an in-depth analysis detailing your home's value as well as a comparison with similar homes in the area
Home Values in the Area
Average Home Value in this Area
Purchase History
| Date | Buyer | Sale Price | Title Company |
|---|---|---|---|
| Katz Jason | $1,103,011 | Equity Title | |
| 118 No Detroit Llc | -- | None Available | |
| Bernstein Saul | -- | United Title Company | |
| Strazynski Nancy | -- | Fidelity Title |
Source: Public Records
Mortgage History
| Date | Status | Borrower | Loan Amount |
|---|---|---|---|
| Open | Katz Jason | $882,400 | |
| Previous Owner | Bernstein Saul | $568,750 |
Source: Public Records
Tax History Compared to Growth
Tax History
| Year | Tax Paid | Tax Assessment Tax Assessment Total Assessment is a certain percentage of the fair market value that is determined by local assessors to be the total taxable value of land and additions on the property. | Land | Improvement |
|---|---|---|---|---|
| 2025 | $16,795 | $1,385,416 | $879,232 | $506,184 |
| 2024 | $16,795 | $1,358,252 | $861,993 | $496,259 |
| 2023 | $16,475 | $1,331,621 | $845,092 | $486,529 |
| 2022 | $15,718 | $1,305,512 | $828,522 | $476,990 |
| 2021 | $15,504 | $1,279,915 | $812,277 | $467,638 |
| 2019 | $15,041 | $1,241,954 | $788,186 | $453,768 |
| 2018 | $14,901 | $1,217,603 | $772,732 | $444,871 |
| 2016 | $14,215 | $1,170,325 | $742,727 | $427,598 |
| 2015 | $14,007 | $1,152,747 | $731,571 | $421,176 |
| 2014 | $14,056 | $1,130,167 | $717,241 | $412,926 |
Source: Public Records
Map
Nearby Homes
- 147 N Detroit St
- 109 N Sycamore Ave Unit 102
- 143 N Sycamore Ave
- 183 S Detroit St
- 120 N Orange Dr
- 203 S Detroit St Unit 201
- 160 S Poinsettia Place
- 101 S Fuller Ave
- 315 N Martel Ave
- 143 S Highland Ave
- 420 N Orange Dr
- 344 N Vista St
- 434 N Mansfield Ave
- 107 S Gardner St
- 530 N Alta Vista Blvd
- 525 N Sycamore Ave Unit 326
- 525 N Sycamore Ave Unit 301
- 525 N Sycamore Ave Unit 304
- 358 S Sycamore Ave
- 191 S Gardner St
- 122 N Detroit St Unit 122A
- 122 N Detroit St
- 112 N Detroit St
- 126 N Detroit St
- 108 N Detroit St
- 132 N Detroit St
- 100 N Detroit St
- 105 N Detroit St
- 111 N Detroit St
- 119 S Detroit St
- 119 S Detroit St
- 123 N Detroit St
- 113 N Detroit St
- 138 N Detroit St Unit upper
- 138 N Detroit St
- 136 N Detroit St
- 127 N Detroit St
- 109 N Detroit St
- 133 N Detroit St
- 103 N Detroit St