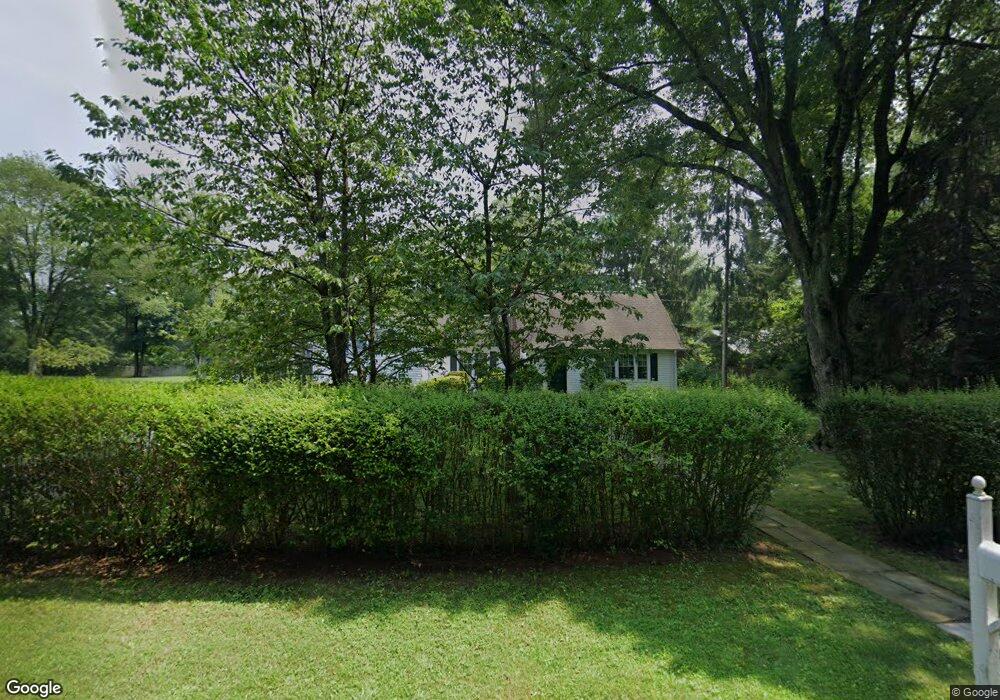
118 Stockton Ave Princeton, NJ 08540
Estimated Value: $411,000 - $625,000
4
Beds
3
Baths
1,766
Sq Ft
$309/Sq Ft
Est. Value
About This Home
This home is located at 118 Stockton Ave, Princeton, NJ 08540 and is currently estimated at $545,988, approximately $309 per square foot. 118 Stockton Ave is a home located in Somerset County with nearby schools including Franklin High School, Guidepost Montessori at Kendall Park, and St. Augustine of Canterbury School.
Ownership History
Date
Name
Owned For
Owner Type
Purchase Details
Closed on
Jul 3, 2018
Sold by
Jones Elliot V and Jones Diane R
Bought by
Headley Davidson and Headley Susan
Current Estimated Value
Home Financials for this Owner
Home Financials are based on the most recent Mortgage that was taken out on this home.
Original Mortgage
$294,566
Outstanding Balance
$255,285
Interest Rate
4.5%
Mortgage Type
FHA
Estimated Equity
$290,703
Purchase Details
Closed on
Jan 11, 2013
Sold by
Wallach Elliot J and Wallach Diane Jones
Bought by
Jones Elliot and Jones Diane R
Purchase Details
Closed on
Jan 15, 2001
Sold by
Duell Gladys
Bought by
Wallace Elliot and Wallace Diane
Home Financials for this Owner
Home Financials are based on the most recent Mortgage that was taken out on this home.
Original Mortgage
$187,329
Interest Rate
7.08%
Mortgage Type
FHA
Purchase Details
Closed on
Sep 29, 1992
Sold by
Thorkildsen Anne
Bought by
Duell Gladys and Duell Thorkildsen,S
Create a Home Valuation Report for This Property
The Home Valuation Report is an in-depth analysis detailing your home's value as well as a comparison with similar homes in the area
Home Values in the Area
Average Home Value in this Area
Purchase History
| Date | Buyer | Sale Price | Title Company |
|---|---|---|---|
| Headley Davidson | $300,000 | Chicago Title Insurance Co | |
| Jones Elliot | -- | None Available | |
| Wallace Elliot | $180,000 | -- | |
| Duell Gladys | -- | -- |
Source: Public Records
Mortgage History
| Date | Status | Borrower | Loan Amount |
|---|---|---|---|
| Open | Headley Davidson | $294,566 | |
| Previous Owner | Wallace Elliot | $187,329 |
Source: Public Records
Tax History Compared to Growth
Tax History
| Year | Tax Paid | Tax Assessment Tax Assessment Total Assessment is a certain percentage of the fair market value that is determined by local assessors to be the total taxable value of land and additions on the property. | Land | Improvement |
|---|---|---|---|---|
| 2025 | $7,879 | $486,200 | $330,300 | $155,900 |
| 2024 | $7,879 | $437,000 | $330,300 | $106,700 |
| 2023 | $7,532 | $391,900 | $285,200 | $106,700 |
| 2022 | $6,934 | $341,900 | $235,200 | $106,700 |
| 2021 | $6,432 | $291,900 | $185,200 | $106,700 |
| 2020 | $6,368 | $281,900 | $175,200 | $106,700 |
| 2019 | $6,385 | $279,200 | $175,200 | $104,000 |
| 2018 | $6,450 | $279,200 | $175,200 | $104,000 |
| 2017 | $6,243 | $269,200 | $165,200 | $104,000 |
| 2016 | $6,297 | $269,200 | $165,200 | $104,000 |
| 2015 | $6,254 | $269,200 | $165,200 | $104,000 |
| 2014 | $6,136 | $268,200 | $164,200 | $104,000 |
Source: Public Records
Map
Nearby Homes
- 128 Butler Rd
- 900 Canal Rd
- 912 Canal Rd
- 140 Bunker Hill Rd
- 93 Mosher Rd
- 9 Stirrup Way
- 8 Colts Run Rd
- 101 Timberhill Dr
- 19 Desoto Dr
- 730 Township Line Rd
- 22 Arthur Glick Blvd Unit 2506
- 22 Balboa Ln Unit 3806
- 139 Gregory Ln
- 21 Gregory Ln Unit F1
- 93 Gregory La Ln
- 93 Gregory Ln
- 8 Amethyst Way
- 32 Columbus Dr Unit 215
- 122 Stockton Ave
- 103 Bergen Ave
- 110 Stockton Ave
- 105 Bergen Ave
- 118 Bergen Ave
- 114 Bergen Ave
- 117 Stockton Ave
- 109 Stockton Ave
- 125 Sunset Ave
- 129 Stockton Ave
- 117 Sunset Ave
- 121 Sunset Ave
- 101 Stockton Ave
- 106 Bergen Ave
- 102 Stockton Ave
- 109 Sunset Ave
- 325 Ridge Blvd
- 105 Sunset Ave
- 319 Ridge Blvd
- 65 Stockton Ave