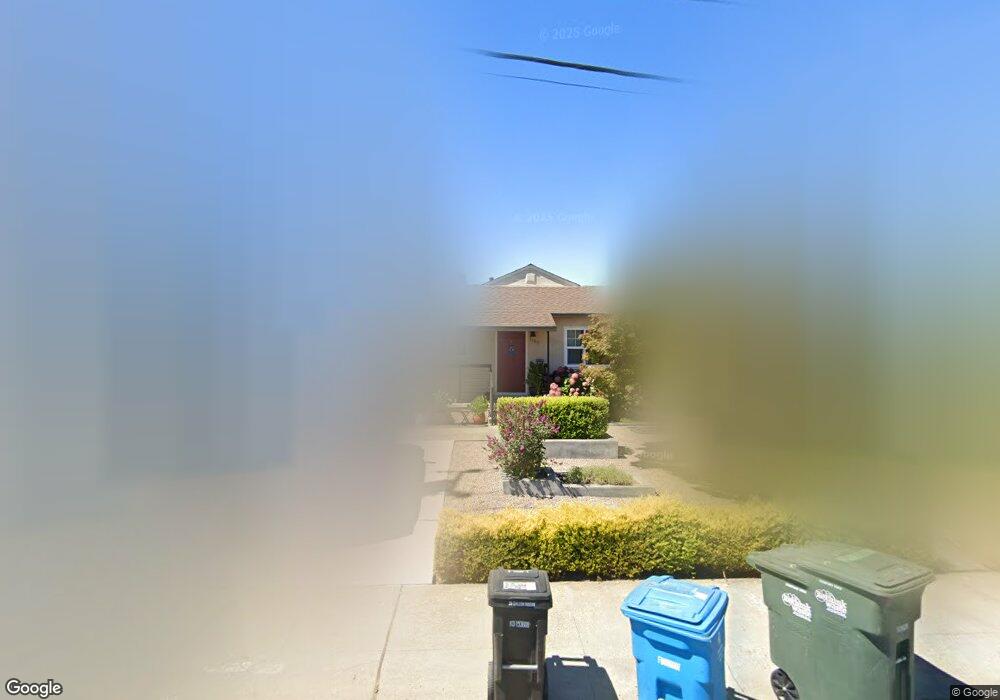
1180 Furlong St Belmont, CA 94002
Homeview NeighborhoodEstimated Value: $1,471,000 - $1,948,000
3
Beds
2
Baths
1,280
Sq Ft
$1,363/Sq Ft
Est. Value
About This Home
This home is located at 1180 Furlong St, Belmont, CA 94002 and is currently estimated at $1,745,086, approximately $1,363 per square foot. 1180 Furlong St is a home located in San Mateo County with nearby schools including Ralston Intermediate School, Carlmont High School, and Acton Academy Silicon Valley.
Ownership History
Date
Name
Owned For
Owner Type
Purchase Details
Closed on
Sep 12, 2020
Sold by
Dijcks Jean Pierre and Ong Dijcks Christine
Bought by
Dijcks Jean Pierre and Ong Dijcks Christine
Current Estimated Value
Purchase Details
Closed on
Jun 28, 2006
Sold by
Kessler John
Bought by
Dijcks Jean Pierre and Ong Dijcks Christine
Home Financials for this Owner
Home Financials are based on the most recent Mortgage that was taken out on this home.
Original Mortgage
$110,900
Outstanding Balance
$65,547
Interest Rate
6.57%
Mortgage Type
Unknown
Estimated Equity
$1,679,539
Purchase Details
Closed on
Feb 5, 2001
Sold by
Skammel Rudolph Joseph and Skammel Rudolf
Bought by
Skammel Rudolph Joseph and Kessler John
Home Financials for this Owner
Home Financials are based on the most recent Mortgage that was taken out on this home.
Original Mortgage
$112,500
Interest Rate
7.08%
Mortgage Type
Stand Alone First
Create a Home Valuation Report for This Property
The Home Valuation Report is an in-depth analysis detailing your home's value as well as a comparison with similar homes in the area
Home Values in the Area
Average Home Value in this Area
Purchase History
| Date | Buyer | Sale Price | Title Company |
|---|---|---|---|
| Dijcks Jean Pierre | -- | None Available | |
| Dijcks Jean Pierre | $740,000 | New Century Title Company | |
| Skammel Rudolph Joseph | -- | Commonwealth Land Title Ins |
Source: Public Records
Mortgage History
| Date | Status | Borrower | Loan Amount |
|---|---|---|---|
| Open | Dijcks Jean Pierre | $110,900 | |
| Open | Dijcks Jean Pierre | $592,000 | |
| Previous Owner | Skammel Rudolph Joseph | $112,500 |
Source: Public Records
Tax History Compared to Growth
Tax History
| Year | Tax Paid | Tax Assessment Tax Assessment Total Assessment is a certain percentage of the fair market value that is determined by local assessors to be the total taxable value of land and additions on the property. | Land | Improvement |
|---|---|---|---|---|
| 2025 | $13,075 | $1,048,194 | $505,628 | $542,566 |
| 2023 | $13,075 | $1,007,494 | $485,995 | $521,499 |
| 2022 | $12,482 | $987,740 | $476,466 | $511,274 |
| 2021 | $12,380 | $968,374 | $467,124 | $501,250 |
| 2020 | $12,117 | $958,447 | $462,335 | $496,112 |
| 2019 | $12,011 | $939,655 | $453,270 | $486,385 |
| 2018 | $11,728 | $921,232 | $444,383 | $476,849 |
| 2017 | $11,300 | $903,170 | $435,670 | $467,500 |
| 2016 | $11,036 | $885,462 | $427,128 | $458,334 |
| 2015 | $10,971 | $872,164 | $420,713 | $451,451 |
| 2014 | $10,039 | $810,000 | $390,500 | $419,500 |
Source: Public Records
Map
Nearby Homes
- 935 Old County Rd Unit 42
- 905 South Rd
- 901 Holly Rd
- 600 El Camino Real Unit 315
- 600 El Camino Real Unit 213
- 1597 Molitor Rd
- 1630 Courtland Rd
- 7 Chestnut St
- 400 El Camino Real Unit 117
- 19 Loma Vista Ln
- 1220 Chula Vista Dr
- 222 Laurel St Unit 109
- 58 Hillcrest Rd
- 180 Elm St
- 1306 North Rd
- 400 Davey Glen Rd Unit 4826
- 131 Northampton Ln
- 140 Northam Ave
- 366 Treasure Island Dr
- 46 Arch Ln
- 1160 Furlong St
- 1200 Furlong St
- 1181 Elmer St
- 1140 Furlong St
- 1220 Furlong St
- 1161 Elmer St
- 1201 Elmer St
- 1181 Furlong St
- 1141 Elmer St
- 1161 Furlong St
- 1221 Elmer St
- 1201 Furlong St
- 1120 Furlong St
- 1240 Furlong St
- 1141 Furlong St
- 1221 Furlong St
- 1121 Elmer St
- 1241 Elmer St
- 1121 Furlong St
- 1241 Furlong St