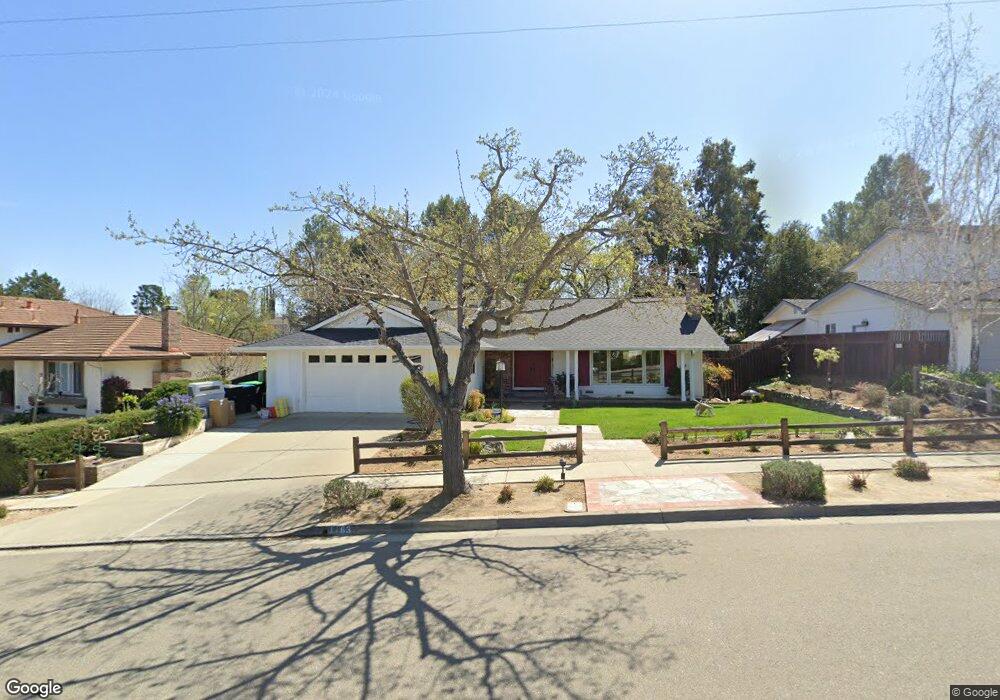
1183 Kottinger Dr Pleasanton, CA 94566
Vintage Hills NeighborhoodEstimated Value: $1,374,884 - $1,657,000
3
Beds
3
Baths
1,598
Sq Ft
$960/Sq Ft
Est. Value
About This Home
This home is located at 1183 Kottinger Dr, Pleasanton, CA 94566 and is currently estimated at $1,533,721, approximately $959 per square foot. 1183 Kottinger Dr is a home located in Alameda County with nearby schools including Vintage Hills Elementary School, Pleasanton Middle School, and Amador Valley High School.
Ownership History
Date
Name
Owned For
Owner Type
Purchase Details
Closed on
Nov 1, 2018
Sold by
Bohn Richard F and Bohn Joyce B
Bought by
Bohn Richard Frederick and Bohn Joyce Bogner
Current Estimated Value
Purchase Details
Closed on
May 8, 2014
Sold by
Barstow Jody
Bought by
Bohn Richard F and Bohn Joyce B
Home Financials for this Owner
Home Financials are based on the most recent Mortgage that was taken out on this home.
Original Mortgage
$475,000
Outstanding Balance
$344,928
Interest Rate
3.12%
Mortgage Type
Adjustable Rate Mortgage/ARM
Estimated Equity
$1,188,793
Purchase Details
Closed on
Jun 3, 2011
Sold by
Barstow Bruce
Bought by
Barstow Jody
Purchase Details
Closed on
Jul 31, 2003
Sold by
Goldsworthy Elizabeth M
Bought by
Barstow Bruce and Barstow Jody
Home Financials for this Owner
Home Financials are based on the most recent Mortgage that was taken out on this home.
Original Mortgage
$385,920
Interest Rate
5.13%
Mortgage Type
Purchase Money Mortgage
Create a Home Valuation Report for This Property
The Home Valuation Report is an in-depth analysis detailing your home's value as well as a comparison with similar homes in the area
Home Values in the Area
Average Home Value in this Area
Purchase History
| Date | Buyer | Sale Price | Title Company |
|---|---|---|---|
| Bohn Richard Frederick | -- | None Available | |
| Bohn Richard F | $810,000 | Old Republic Title Company C | |
| Barstow Jody | -- | None Available | |
| Barstow Bruce | $482,500 | Fidelity National Title Co |
Source: Public Records
Mortgage History
| Date | Status | Borrower | Loan Amount |
|---|---|---|---|
| Open | Bohn Richard F | $475,000 | |
| Previous Owner | Barstow Bruce | $385,920 |
Source: Public Records
Tax History Compared to Growth
Tax History
| Year | Tax Paid | Tax Assessment Tax Assessment Total Assessment is a certain percentage of the fair market value that is determined by local assessors to be the total taxable value of land and additions on the property. | Land | Improvement |
|---|---|---|---|---|
| 2025 | $11,477 | $992,905 | $297,871 | $695,034 |
| 2024 | $11,477 | $973,441 | $292,032 | $681,409 |
| 2023 | $11,346 | $954,357 | $286,307 | $668,050 |
| 2022 | $10,749 | $935,647 | $280,694 | $654,953 |
| 2021 | $10,474 | $917,308 | $275,192 | $642,116 |
| 2020 | $10,340 | $907,904 | $272,371 | $635,533 |
| 2019 | $10,467 | $890,108 | $267,032 | $623,076 |
| 2018 | $10,256 | $872,661 | $261,798 | $610,863 |
| 2017 | $9,994 | $855,554 | $256,666 | $598,888 |
| 2016 | $9,228 | $838,778 | $251,633 | $587,145 |
| 2015 | $9,056 | $826,183 | $247,855 | $578,328 |
| 2014 | $6,311 | $559,482 | $167,937 | $391,545 |
Source: Public Records
Map
Nearby Homes
- 3550 Arbor Ct
- 1312 Vintner Way
- 665 Palomino Dr Unit D
- 601 Palomino Dr Unit C
- 3379 Arbor Dr
- 786 Bonita Ave
- 3399 Norton Way Unit 6
- 3375 Norton Way Unit 5
- 526 Malbec Ct
- 543 Tawny Dr
- 4253 Mirador Dr
- 789 E Angela St
- 3249 Arbor Dr
- 373 Linden Way
- 3134 Arbor Dr
- 3126 Arbor Dr
- 215 Mavis Dr
- 262 Birch Creek Dr
- 3845 Vineyard Ave Unit F
- 236 Birch Creek Terrace Unit 14
- 1175 Kottinger Dr
- 1191 Kottinger Dr
- 1167 Kottinger Dr
- 1199 Kottinger Dr
- 1180 Kottinger Dr
- 1188 Kottinger Dr
- 1172 Kottinger Dr
- 1192 Kottinger Dr
- 1159 Kottinger Dr
- 1198 Kottinger Dr
- 3764 Riesling Ct
- 1151 Kottinger Dr
- 3728 Riesling Ct
- 3710 Riesling Ct
- 1050 Concord St
- 1032 Concord St
- 1012 Concord St
- 1143 Kottinger Dr
- 996 Concord St
- 1086 Concord St