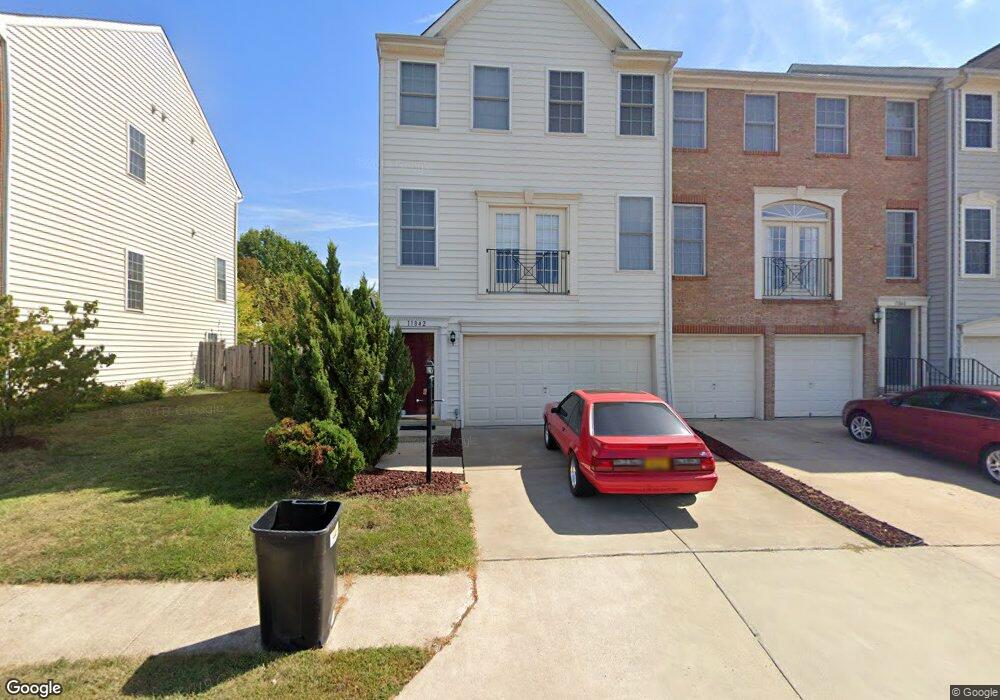
11842 Medway Church Loop Manassas, VA 20109
Estimated Value: $565,149 - $628,000
3
Beds
4
Baths
1,912
Sq Ft
$307/Sq Ft
Est. Value
About This Home
This home is located at 11842 Medway Church Loop, Manassas, VA 20109 and is currently estimated at $586,287, approximately $306 per square foot. 11842 Medway Church Loop is a home located in Prince William County with nearby schools including Chris Yung Elementary School, Gainesville Middle School, and Unity Reed High School.
Ownership History
Date
Name
Owned For
Owner Type
Purchase Details
Closed on
Aug 13, 2018
Sold by
Marine Edward L and Marine Erika
Bought by
Marine Edward L
Current Estimated Value
Purchase Details
Closed on
Sep 30, 2011
Sold by
Humes Daryl
Bought by
Marine Edward L and Marine Erika
Home Financials for this Owner
Home Financials are based on the most recent Mortgage that was taken out on this home.
Original Mortgage
$282,648
Outstanding Balance
$194,166
Interest Rate
4.25%
Mortgage Type
FHA
Estimated Equity
$392,121
Purchase Details
Closed on
Oct 31, 2003
Sold by
Us Home Corp
Bought by
Humes Daryl
Home Financials for this Owner
Home Financials are based on the most recent Mortgage that was taken out on this home.
Original Mortgage
$238,744
Interest Rate
6.05%
Mortgage Type
New Conventional
Create a Home Valuation Report for This Property
The Home Valuation Report is an in-depth analysis detailing your home's value as well as a comparison with similar homes in the area
Home Values in the Area
Average Home Value in this Area
Purchase History
| Date | Buyer | Sale Price | Title Company |
|---|---|---|---|
| Marine Edward L | -- | None Available | |
| Marine Edward L | $290,000 | Stewart Title Guaranty Compa | |
| Humes Daryl | $298,430 | -- |
Source: Public Records
Mortgage History
| Date | Status | Borrower | Loan Amount |
|---|---|---|---|
| Open | Marine Edward L | $282,648 | |
| Previous Owner | Humes Daryl | $238,744 |
Source: Public Records
Tax History Compared to Growth
Tax History
| Year | Tax Paid | Tax Assessment Tax Assessment Total Assessment is a certain percentage of the fair market value that is determined by local assessors to be the total taxable value of land and additions on the property. | Land | Improvement |
|---|---|---|---|---|
| 2025 | $5,125 | $552,800 | $152,500 | $400,300 |
| 2024 | $5,125 | $515,300 | $145,200 | $370,100 |
| 2023 | $5,040 | $484,400 | $130,100 | $354,300 |
| 2022 | $5,031 | $454,300 | $125,200 | $329,100 |
| 2021 | $5,007 | $410,400 | $104,000 | $306,400 |
| 2020 | $6,011 | $387,800 | $87,800 | $300,000 |
| 2019 | $5,529 | $356,700 | $83,600 | $273,100 |
| 2018 | $4,006 | $331,800 | $79,500 | $252,300 |
| 2017 | $4,014 | $325,000 | $79,500 | $245,500 |
| 2016 | $3,992 | $326,300 | $76,600 | $249,700 |
| 2015 | $3,671 | $311,000 | $76,600 | $234,400 |
| 2014 | $3,671 | $293,100 | $73,000 | $220,100 |
Source: Public Records
Map
Nearby Homes
- 9090 Brewer Creek Place
- 11909 Molly Pitcher Cir
- 9073 Ribbon Falls Loop
- 12100 Brevard Park Ct
- 9218 Dawkins Crest Cir
- 12324 Malvern Way
- 8768 Dunstable Loop
- 12673 Crabtree Falls Dr
- 11479 Robertson Dr
- 8537 Trade Wind Ct
- 8650 Lovelace St
- 8632 Lovelace St
- 9256 Crestview Ridge Dr
- 8629 Lovelace St
- 8619 Lovelace St
- The Tessa Plan at Innovation Town Center - Condos
- 8411 Lanier Overlook Ct
- 8641 Lovelace St
- 8633 Lovelace St
- 8784 Noether St
- 11840 Medway Church Loop
- 11846 Medway Church Loop
- 11838 Medway Church Loop
- 11848 Medway Church Loop
- 11836 Medway Church Loop
- 11850 Medway Church Loop
- 11832 Medway Church Loop
- 8729 Phipps Farm Way
- 11852 Medway Church Loop
- 11830 Medway Church Loop
- 8727 Phipps Farm Way
- 11828 Medway Church Loop
- 8725 Phipps Farm Way
- 8723 Phipps Farm Way
- 11826 Medway Church Loop
- 8721 Phipps Farm Way
- 8719 Phipps Farm Way
- 8732 Phipps Farm Way
- 8734 Phipps Farm Way
- 8736 Phipps Farm Way