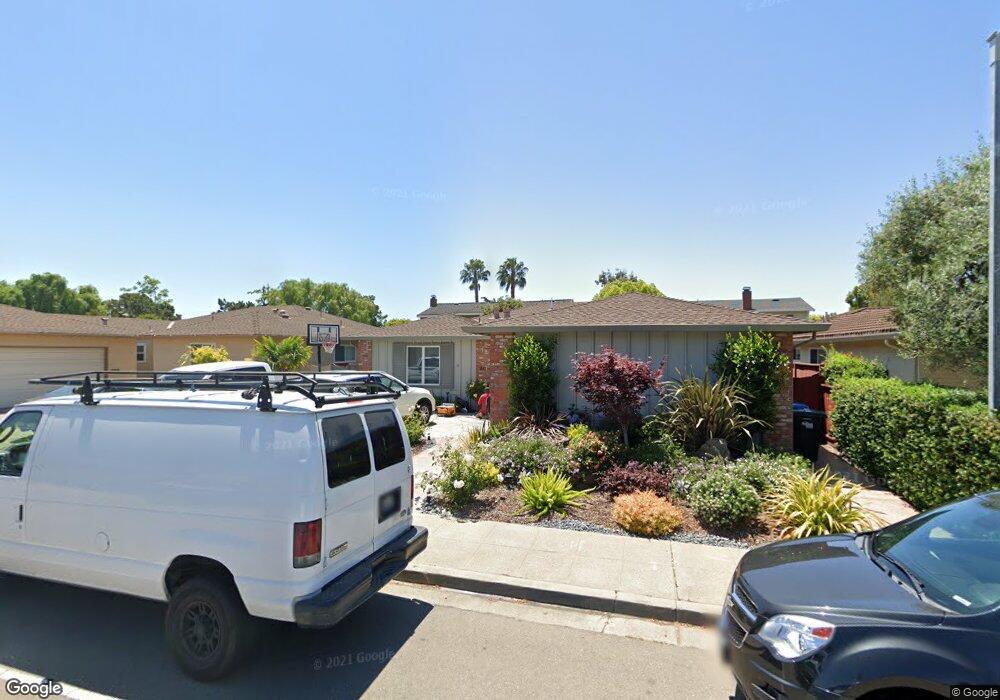
1189 Flying Fish St Foster City, CA 94404
Carmel Village NeighborhoodEstimated Value: $2,160,000 - $2,522,000
4
Beds
3
Baths
2,450
Sq Ft
$946/Sq Ft
Est. Value
About This Home
This home is located at 1189 Flying Fish St, Foster City, CA 94404 and is currently estimated at $2,317,205, approximately $945 per square foot. 1189 Flying Fish St is a home located in San Mateo County with nearby schools including Audubon Elementary School, Bowditch Middle School, and San Mateo High School.
Ownership History
Date
Name
Owned For
Owner Type
Purchase Details
Closed on
Apr 11, 2006
Sold by
Shoman Nahla
Bought by
Shoman Nahla
Current Estimated Value
Purchase Details
Closed on
Aug 6, 1996
Sold by
Shoman Khalid
Bought by
Shoman Nahla
Home Financials for this Owner
Home Financials are based on the most recent Mortgage that was taken out on this home.
Original Mortgage
$207,000
Interest Rate
7.69%
Create a Home Valuation Report for This Property
The Home Valuation Report is an in-depth analysis detailing your home's value as well as a comparison with similar homes in the area
Home Values in the Area
Average Home Value in this Area
Purchase History
| Date | Buyer | Sale Price | Title Company |
|---|---|---|---|
| Shoman Nahla | -- | None Available | |
| Shoman Nahla | -- | Fidelity National Title Co |
Source: Public Records
Mortgage History
| Date | Status | Borrower | Loan Amount |
|---|---|---|---|
| Closed | Shoman Nahla | $207,000 |
Source: Public Records
Tax History Compared to Growth
Tax History
| Year | Tax Paid | Tax Assessment Tax Assessment Total Assessment is a certain percentage of the fair market value that is determined by local assessors to be the total taxable value of land and additions on the property. | Land | Improvement |
|---|---|---|---|---|
| 2025 | $4,416 | $353,035 | $95,457 | $257,578 |
| 2023 | $4,416 | $339,328 | $91,751 | $247,577 |
| 2022 | $4,252 | $332,675 | $89,952 | $242,723 |
| 2021 | $4,187 | $326,153 | $88,189 | $237,964 |
| 2020 | $4,074 | $322,809 | $87,285 | $235,524 |
| 2019 | $3,869 | $316,480 | $85,574 | $230,906 |
| 2018 | $3,504 | $310,276 | $83,897 | $226,379 |
| 2017 | $3,462 | $304,193 | $82,252 | $221,941 |
| 2016 | $3,589 | $298,230 | $80,640 | $217,590 |
| 2015 | $3,503 | $293,751 | $79,429 | $214,322 |
| 2014 | $3,413 | $287,998 | $77,874 | $210,124 |
Source: Public Records
Map
Nearby Homes
- 1336 Marlin Ave
- 1074 Eagle Ln
- 241 Bonita Ln
- 1351 Marlin Ave
- 1463 Marlin Ave
- 224 Loon Ct
- 888 Sea Island Ln
- 370 Bramble Ct
- 1131 Compass Ln Unit 108
- 1061 Beach Park Blvd Unit 216
- 1171 Compass Ln Unit 211
- 3206 Admiralty Ln
- 1102 Admiralty Ln
- 275 Puffin Ct
- 1028 Foster Square Ln Unit 305
- 769 Eppleton Ln Unit 302
- 708 Thayer Ln Unit 404
- 591 Pilgrim Dr
- 822 Magellan Ln
- 1017 Shell Blvd Unit 12
- 1199 Flying Fish St
- 1179 Flying Fish St
- 1121 Marlin Ave
- 1141 Marlin Ave
- 1101 Marlin Ave
- 1169 Flying Fish St
- 1161 Marlin Ave
- 1190 Flying Fish St
- 1180 Flying Fish St
- 1181 Marlin Ave
- 1170 Flying Fish St
- 1159 Flying Fish St
- 1160 Flying Fish St
- 1199 Marlin Ave
- 1149 Flying Fish St
- 1140 Marlin Ave
- 1120 Marlin Ave
- 1150 Flying Fish St
- 1160 Marlin Ave
- 1100 Marlin Ave