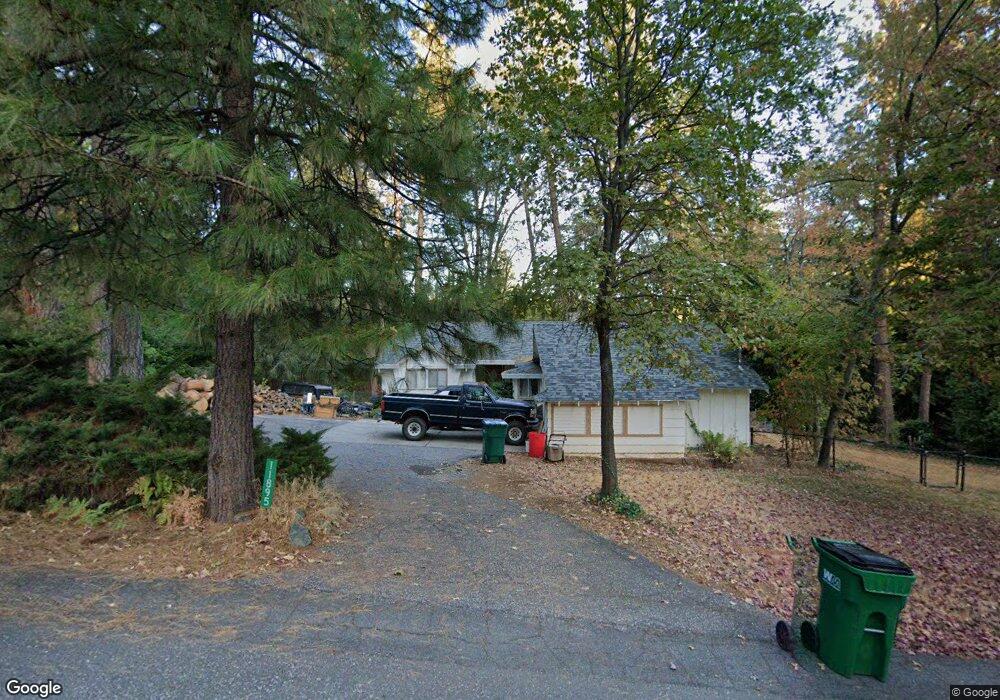
11895 Black Oak Dr Nevada City, CA 95959
Estimated Value: $500,928 - $631,000
3
Beds
2
Baths
1,627
Sq Ft
$336/Sq Ft
Est. Value
About This Home
This home is located at 11895 Black Oak Dr, Nevada City, CA 95959 and is currently estimated at $546,732, approximately $336 per square foot. 11895 Black Oak Dr is a home located in Nevada County with nearby schools including Deer Creek Elementary School, Seven Hills Intermediate School, and Twin Ridges Home Study Charter School.
Ownership History
Date
Name
Owned For
Owner Type
Purchase Details
Closed on
Dec 14, 1999
Sold by
Saxon Georgia W Revocable Living Trust and Richard M
Bought by
Desena Stephen L and Desena Kimala T
Current Estimated Value
Home Financials for this Owner
Home Financials are based on the most recent Mortgage that was taken out on this home.
Original Mortgage
$168,000
Outstanding Balance
$52,513
Interest Rate
7.84%
Estimated Equity
$494,219
Create a Home Valuation Report for This Property
The Home Valuation Report is an in-depth analysis detailing your home's value as well as a comparison with similar homes in the area
Home Values in the Area
Average Home Value in this Area
Purchase History
| Date | Buyer | Sale Price | Title Company |
|---|---|---|---|
| Desena Stephen L | $210,000 | California Land Title Co |
Source: Public Records
Mortgage History
| Date | Status | Borrower | Loan Amount |
|---|---|---|---|
| Open | Desena Stephen L | $168,000 |
Source: Public Records
Tax History Compared to Growth
Tax History
| Year | Tax Paid | Tax Assessment Tax Assessment Total Assessment is a certain percentage of the fair market value that is determined by local assessors to be the total taxable value of land and additions on the property. | Land | Improvement |
|---|---|---|---|---|
| 2025 | $3,492 | $322,739 | $138,314 | $184,425 |
| 2024 | $3,421 | $316,411 | $135,602 | $180,809 |
| 2023 | $3,421 | $310,208 | $132,944 | $177,264 |
| 2022 | $3,349 | $304,127 | $130,338 | $173,789 |
| 2021 | $3,255 | $298,165 | $127,783 | $170,382 |
| 2020 | $3,244 | $295,108 | $126,473 | $168,635 |
| 2019 | $3,176 | $289,323 | $123,994 | $165,329 |
| 2018 | $3,112 | $283,651 | $121,563 | $162,088 |
| 2017 | $3,051 | $278,090 | $119,180 | $158,910 |
| 2016 | $2,939 | $272,639 | $116,844 | $155,795 |
| 2015 | $2,896 | $268,544 | $115,089 | $153,455 |
| 2014 | $2,896 | $263,285 | $112,835 | $150,450 |
Source: Public Records
Map
Nearby Homes
- 11945 Black Oak Dr
- 10680 Success Cross Rd
- 11118 Banner Lava Cap Rd
- 11382 Cour Royal
- 11021 Pittsburg Mine Rd
- 11464 Banner Lava Cap Rd
- 11551 Forest View Dr
- 11854 Tree Top Cir
- 11732 Forest View Dr
- 111 Lone Jack Ct
- 306 Lone Jack Ct Unit 24
- 202 Gold Flat Rd
- 506 Liberty Ct
- 607 Cold Spring Ct
- 614 Cold Spring Ct
- 606 Cold Spring Ct
- 611 Cold Spring Ct
- 605 Cold Spring Ct
- 136 Jackrabbit Rd
- 114 Jackrabbit Rd
- 11865 Black Oak Dr
- 11929 Black Oak Dr
- 11040 Banner Mine Way
- 11884 Black Oak Dr
- 11912 Black Oak Dr
- 11060 Banner Mine Way
- 11835 Black Oak Dr
- 11852 Black Oak Dr
- 12582 Gayle Ln
- 11051 Crescent Dr
- 11088 Crescent Dr
- 12546 Gayle Ln
- 11010 Banner Mine Way
- 11157 Crescent Dr
- 11056 Crescent Dr
- 11955 Black Oak Dr