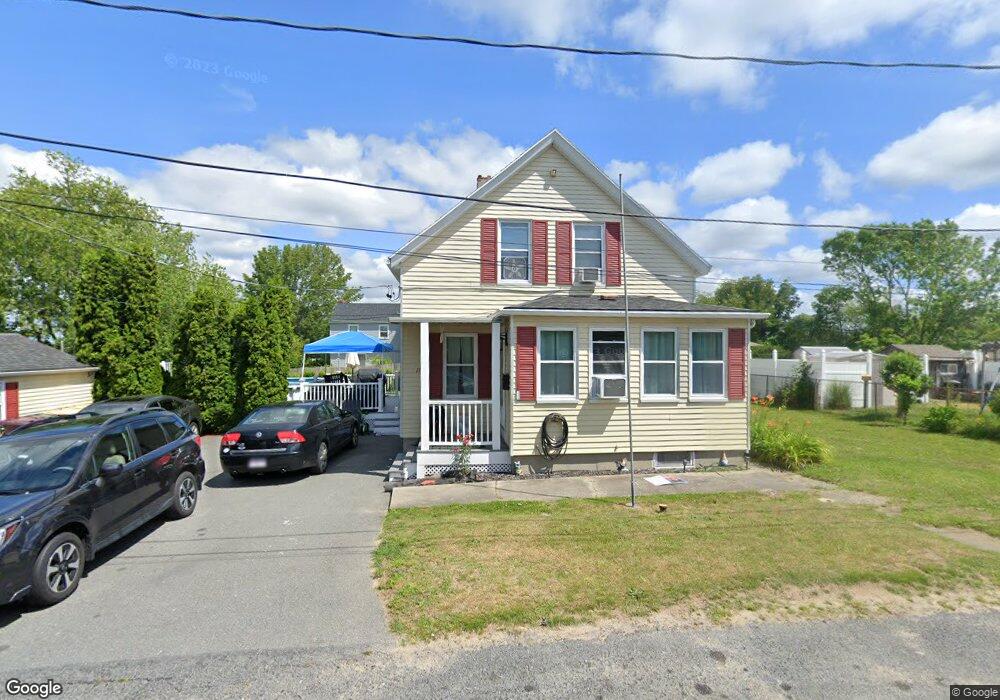
119 Francis St Acushnet, MA 02743
North Fairhaven NeighborhoodEstimated Value: $347,000 - $427,910
3
Beds
1
Bath
1,397
Sq Ft
$276/Sq Ft
Est. Value
About This Home
This home is located at 119 Francis St, Acushnet, MA 02743 and is currently estimated at $386,228, approximately $276 per square foot. 119 Francis St is a home located in Bristol County with nearby schools including Acushnet Elementary School, Albert F Ford Middle School, and Alma Del Mar Charter School.
Ownership History
Date
Name
Owned For
Owner Type
Purchase Details
Closed on
May 28, 2021
Sold by
Lewis James H
Bought by
Lewis James H and Lewis Lori
Current Estimated Value
Purchase Details
Closed on
Jun 27, 2003
Sold by
Figueiredo Celeste V and Vicencio Jose D
Bought by
Lewis James H and Lewis James
Home Financials for this Owner
Home Financials are based on the most recent Mortgage that was taken out on this home.
Original Mortgage
$150,000
Interest Rate
5.53%
Mortgage Type
Purchase Money Mortgage
Create a Home Valuation Report for This Property
The Home Valuation Report is an in-depth analysis detailing your home's value as well as a comparison with similar homes in the area
Home Values in the Area
Average Home Value in this Area
Purchase History
| Date | Buyer | Sale Price | Title Company |
|---|---|---|---|
| Lewis James H | -- | None Available | |
| Lewis James H | $170,000 | -- |
Source: Public Records
Mortgage History
| Date | Status | Borrower | Loan Amount |
|---|---|---|---|
| Previous Owner | Lewis James H | $150,000 |
Source: Public Records
Tax History Compared to Growth
Tax History
| Year | Tax Paid | Tax Assessment Tax Assessment Total Assessment is a certain percentage of the fair market value that is determined by local assessors to be the total taxable value of land and additions on the property. | Land | Improvement |
|---|---|---|---|---|
| 2025 | $35 | $325,000 | $90,200 | $234,800 |
| 2024 | $3,517 | $308,200 | $86,000 | $222,200 |
| 2023 | $3,313 | $276,100 | $77,700 | $198,400 |
| 2022 | $3,397 | $256,000 | $73,500 | $182,500 |
| 2021 | $3,116 | $225,300 | $73,500 | $151,800 |
| 2020 | $3,141 | $225,300 | $73,500 | $151,800 |
| 2019 | $2,922 | $206,100 | $65,100 | $141,000 |
| 2018 | $2,823 | $195,800 | $65,100 | $130,700 |
| 2017 | $2,712 | $187,800 | $65,100 | $122,700 |
| 2016 | $2,595 | $178,600 | $65,100 | $113,500 |
| 2015 | $2,550 | $178,600 | $65,100 | $113,500 |
Source: Public Records
Map
Nearby Homes