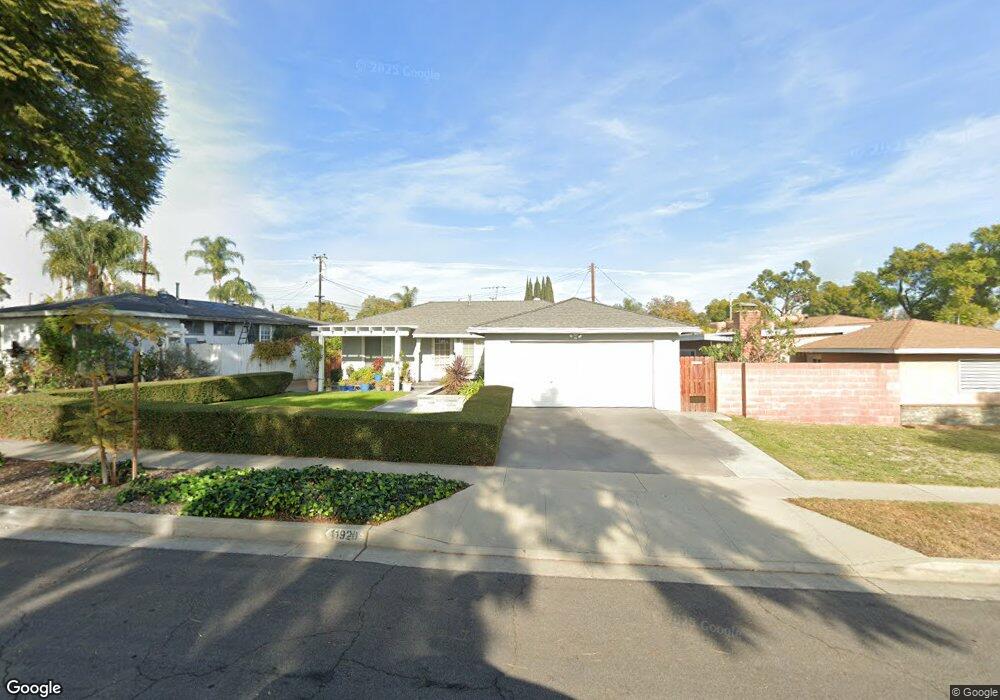
11920 Nashville Ave La Mirada, CA 90638
East Whittier NeighborhoodEstimated Value: $751,659 - $821,000
3
Beds
2
Baths
1,085
Sq Ft
$727/Sq Ft
Est. Value
About This Home
This home is located at 11920 Nashville Ave, La Mirada, CA 90638 and is currently estimated at $789,165, approximately $727 per square foot. 11920 Nashville Ave is a home located in Los Angeles County with nearby schools including Scott Avenue Elementary School, Granada Middle School, and La Serna High School.
Ownership History
Date
Name
Owned For
Owner Type
Purchase Details
Closed on
Apr 10, 1998
Sold by
Adamo Terence V
Bought by
Hovenden Dennis D and Hovenden Connie A
Current Estimated Value
Home Financials for this Owner
Home Financials are based on the most recent Mortgage that was taken out on this home.
Original Mortgage
$158,940
Interest Rate
7.07%
Mortgage Type
FHA
Purchase Details
Closed on
Jan 21, 1998
Sold by
Adamo Gloria M
Bought by
Adamo Terence V
Purchase Details
Closed on
Jun 6, 1996
Sold by
Adamo Frank J and Adamo Joan M
Bought by
Adamo Terence V and Adamo Gloria M
Purchase Details
Closed on
Mar 5, 1996
Sold by
Heweson Constance
Bought by
Adamo Frank J and Adamo Joan M
Home Financials for this Owner
Home Financials are based on the most recent Mortgage that was taken out on this home.
Original Mortgage
$135,000
Interest Rate
7.41%
Create a Home Valuation Report for This Property
The Home Valuation Report is an in-depth analysis detailing your home's value as well as a comparison with similar homes in the area
Home Values in the Area
Average Home Value in this Area
Purchase History
| Date | Buyer | Sale Price | Title Company |
|---|---|---|---|
| Hovenden Dennis D | $162,500 | Orange Coast Title | |
| Adamo Terence V | -- | -- | |
| Adamo Terence V | -- | -- | |
| Adamo Frank J | $150,000 | American Title Ins Co |
Source: Public Records
Mortgage History
| Date | Status | Borrower | Loan Amount |
|---|---|---|---|
| Previous Owner | Hovenden Dennis D | $158,940 | |
| Previous Owner | Adamo Frank J | $135,000 |
Source: Public Records
Tax History Compared to Growth
Tax History
| Year | Tax Paid | Tax Assessment Tax Assessment Total Assessment is a certain percentage of the fair market value that is determined by local assessors to be the total taxable value of land and additions on the property. | Land | Improvement |
|---|---|---|---|---|
| 2025 | $3,460 | $266,676 | $144,491 | $122,185 |
| 2024 | $3,460 | $261,448 | $141,658 | $119,790 |
| 2023 | $3,403 | $256,323 | $138,881 | $117,442 |
| 2022 | $3,330 | $251,298 | $136,158 | $115,140 |
| 2021 | $3,265 | $246,372 | $133,489 | $112,883 |
| 2019 | $3,200 | $239,067 | $129,531 | $109,536 |
| 2018 | $3,055 | $234,381 | $126,992 | $107,389 |
| 2016 | $2,891 | $225,281 | $122,061 | $103,220 |
| 2015 | $2,871 | $221,898 | $120,228 | $101,670 |
| 2014 | $2,837 | $217,552 | $117,873 | $99,679 |
Source: Public Records
Map
Nearby Homes
- 15032 Olive Ln
- 15026 Olive Ln
- 15216 Mccann Place
- 11518 Toerge Dr
- 11735 Gayview Dr
- 14927 Leffingwell Rd Unit 22
- 14927 Leffingwell Rd Unit 17
- 11314 La Mirada Blvd
- 15041 Cerecita Dr
- 12212 Hillwood Dr
- 12108 Springview Dr
- 14943 Gagely Dr
- 12311 Moline Dr
- 11124 Stamy Rd
- 15246 Mystic St
- 11245 Gladhill Rd Unit 10
- 11134 Arroyo Dr
- 12010 La Cima Dr
- 11502 Double Eagle Dr
- 11237 Gladhill Rd Unit 3
- 11912 Nashville Ave
- 15107 Fairacres Dr
- 15113 Fairacres Dr
- 11906 Nashville Ave
- 15060 Granada Ave
- 15119 Fairacres Dr
- 15066 Granada Ave
- 11923 Nashville Ave
- 11917 Nashville Ave
- 11911 Nashville Ave
- 11929 Nashville Ave
- 15070 Granada Ave
- 15125 Fairacres Dr
- 15108 Fairacres Dr
- 15102 Fairacres Dr
- 15114 Fairacres Dr
- 15062 Fairacres Dr
- 15038 Granada Ave
- 15076 Granada Ave
- 15118 Fairacres Dr