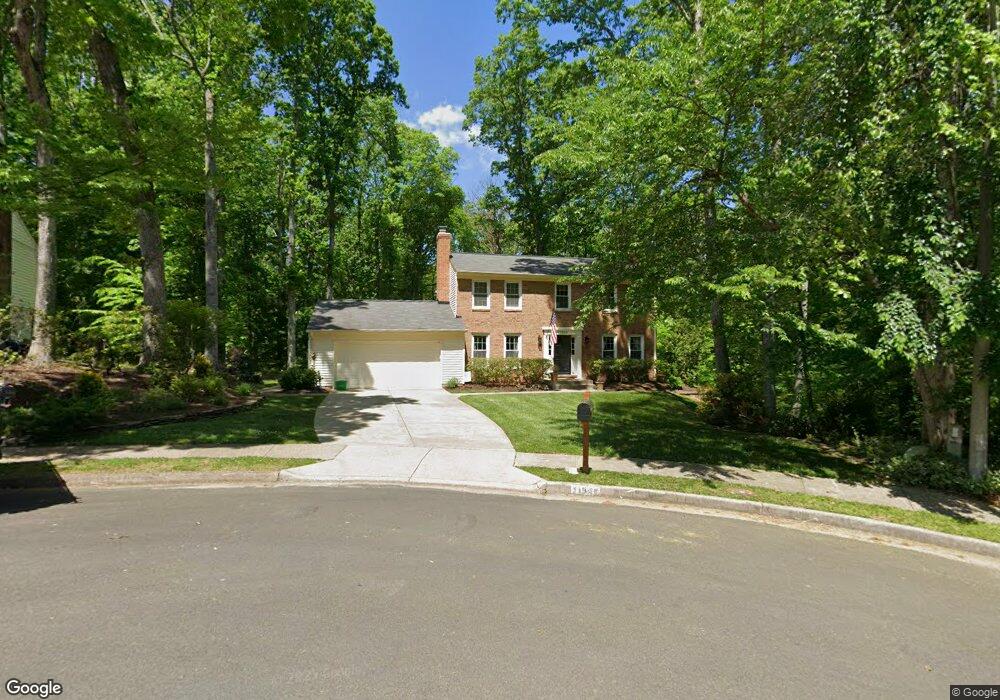
11944 Shenandoah Ct Woodbridge, VA 22192
Estimated Value: $662,380 - $698,000
4
Beds
4
Baths
1,764
Sq Ft
$383/Sq Ft
Est. Value
About This Home
This home is located at 11944 Shenandoah Ct, Woodbridge, VA 22192 and is currently estimated at $674,845, approximately $382 per square foot. 11944 Shenandoah Ct is a home located in Prince William County with nearby schools including Antietam Elementary School, Lake Ridge Middle School, and Woodbridge High School.
Ownership History
Date
Name
Owned For
Owner Type
Purchase Details
Closed on
Apr 29, 2004
Sold by
Libby Jeffrey A
Bought by
Dean Darin D
Current Estimated Value
Home Financials for this Owner
Home Financials are based on the most recent Mortgage that was taken out on this home.
Original Mortgage
$317,600
Outstanding Balance
$147,441
Interest Rate
5.36%
Mortgage Type
New Conventional
Estimated Equity
$527,404
Purchase Details
Closed on
Aug 7, 2001
Sold by
Teselle Garrett Henry
Bought by
Dean Darin D
Home Financials for this Owner
Home Financials are based on the most recent Mortgage that was taken out on this home.
Original Mortgage
$204,000
Interest Rate
7.1%
Purchase Details
Closed on
Aug 6, 1996
Sold by
Kriethe Jackie L
Bought by
Teselle Henry
Home Financials for this Owner
Home Financials are based on the most recent Mortgage that was taken out on this home.
Original Mortgage
$150,000
Interest Rate
8.27%
Create a Home Valuation Report for This Property
The Home Valuation Report is an in-depth analysis detailing your home's value as well as a comparison with similar homes in the area
Home Values in the Area
Average Home Value in this Area
Purchase History
| Date | Buyer | Sale Price | Title Company |
|---|---|---|---|
| Dean Darin D | $397,000 | -- | |
| Dean Darin D | $255,000 | -- | |
| Teselle Henry | $200,000 | -- |
Source: Public Records
Mortgage History
| Date | Status | Borrower | Loan Amount |
|---|---|---|---|
| Open | Dean Darin D | $317,600 | |
| Previous Owner | Dean Darin D | $204,000 | |
| Previous Owner | Teselle Henry | $150,000 | |
| Closed | Teselle Henry | $30,000 |
Source: Public Records
Tax History Compared to Growth
Tax History
| Year | Tax Paid | Tax Assessment Tax Assessment Total Assessment is a certain percentage of the fair market value that is determined by local assessors to be the total taxable value of land and additions on the property. | Land | Improvement |
|---|---|---|---|---|
| 2025 | $5,835 | $627,500 | $199,200 | $428,300 |
| 2024 | $5,835 | $586,700 | $186,300 | $400,400 |
| 2023 | $5,959 | $572,700 | $180,000 | $392,700 |
| 2022 | $6,116 | $552,200 | $165,700 | $386,500 |
| 2021 | $5,970 | $489,400 | $149,300 | $340,100 |
| 2020 | $7,045 | $454,500 | $139,300 | $315,200 |
| 2019 | $6,699 | $432,200 | $140,200 | $292,000 |
| 2018 | $5,063 | $419,300 | $134,500 | $284,800 |
| 2017 | $5,092 | $412,900 | $132,100 | $280,800 |
| 2016 | $5,051 | $413,500 | $131,200 | $282,300 |
| 2015 | $4,844 | $385,000 | $121,500 | $263,500 |
| 2014 | $4,844 | $387,800 | $121,500 | $266,300 |
Source: Public Records
Map
Nearby Homes
- 11977 William And Mary Cir
- 2568 Tree House Dr
- 12220 Redwood Ct
- 2735 King Iron Ct
- 12006 Skipjack Ct
- 2842 Burgundy Place
- 2840 Chablis Cir Unit 11A
- 12306 Woodlawn Ct
- 2801 Mintwood Ct
- 2921 Lexington Ct
- 2847 Seminole Rd
- 12302 Harbor Dr
- 12502 Colby Dr
- 3098 Fennegan Ct
- 2549 Fox Ridge Ct Unit 68
- 12020 Torrey Pine Ct
- 2937 Cambridge Dr
- 9209 Franks Point Ln
- 9205 Franks Point Ln
- 3178 Vanderbilt Ct
- 11946 Shenandoah Ct
- 11942 Shenandoah Ct
- 11948 Shenandoah Ct
- 11943 Shenandoah Ct
- 11961 Dolly Madison Cir
- 11945 Shenandoah Ct
- 11940 Shenandoah Ct
- 11939 Shenandoah Ct
- 11963 Dolly Madison Cir
- 11950 Shenandoah Ct
- 11941 Shenandoah Ct
- 11965 Dolly Madison Cir
- 11952 Shenandoah Ct
- 11960 Dolly Madison Cir
- 11949 Shenandoah Ct
- 11967 Dolly Madison Cir
- 11962 Dolly Madison Cir
- 11954 Shenandoah Ct
- 11951 Shenandoah Ct
- 2499 Tree House Dr