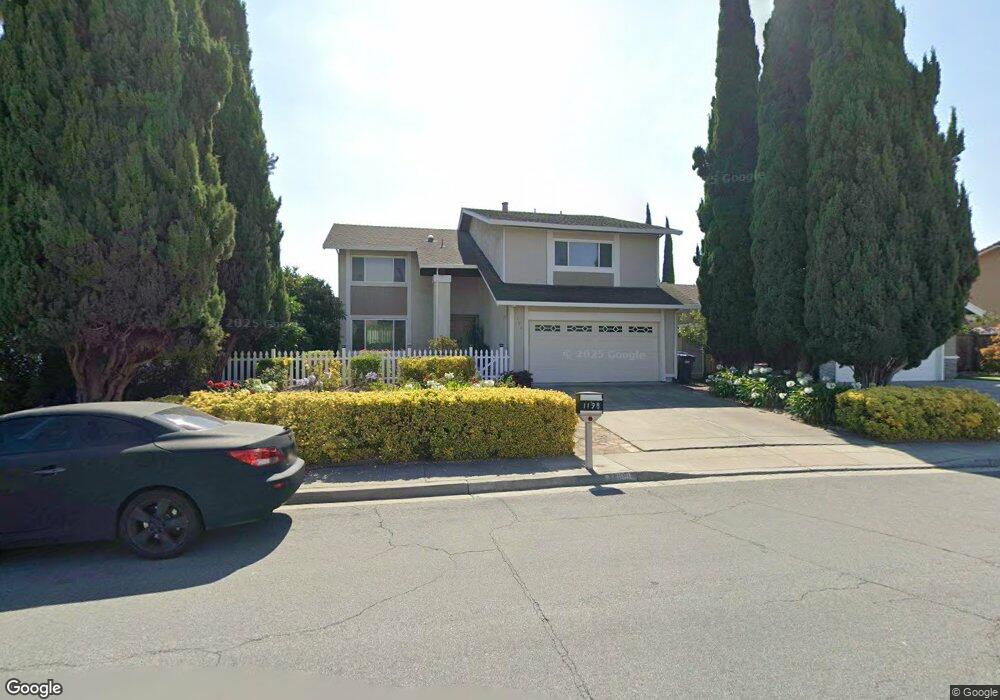
1198 Belbrook Way Milpitas, CA 95035
Estimated Value: $2,105,000 - $2,219,000
4
Beds
3
Baths
2,412
Sq Ft
$902/Sq Ft
Est. Value
About This Home
This home is located at 1198 Belbrook Way, Milpitas, CA 95035 and is currently estimated at $2,176,272, approximately $902 per square foot. 1198 Belbrook Way is a home located in Santa Clara County with nearby schools including Marshall Pomeroy Elementary School, Thomas Russell Middle School, and Milpitas High School.
Ownership History
Date
Name
Owned For
Owner Type
Purchase Details
Closed on
Feb 1, 2021
Sold by
Zhao Yong and Mao Yejia
Bought by
Zhao Yong and Mao Yejia
Current Estimated Value
Purchase Details
Closed on
Jul 1, 2020
Sold by
Mao Yejia and Zhao Yong
Bought by
Y N Y Trust and Zhao
Home Financials for this Owner
Home Financials are based on the most recent Mortgage that was taken out on this home.
Original Mortgage
$260,000
Interest Rate
3.1%
Mortgage Type
New Conventional
Purchase Details
Closed on
Jun 26, 2012
Sold by
Zhao Yong and Mao Yejia
Bought by
Zhao Yong and Mao Yejia
Home Financials for this Owner
Home Financials are based on the most recent Mortgage that was taken out on this home.
Original Mortgage
$409,000
Interest Rate
3.74%
Mortgage Type
New Conventional
Purchase Details
Closed on
Jun 8, 2012
Sold by
Zhao Yong and Mao Yejia
Bought by
Zhao Yong and Mao Yejia
Home Financials for this Owner
Home Financials are based on the most recent Mortgage that was taken out on this home.
Original Mortgage
$409,000
Interest Rate
3.74%
Mortgage Type
New Conventional
Purchase Details
Closed on
Oct 11, 2011
Sold by
Zhao Yong and Mao Yejia
Bought by
Mao Yejia and Zhao Yong
Home Financials for this Owner
Home Financials are based on the most recent Mortgage that was taken out on this home.
Original Mortgage
$412,000
Interest Rate
4.15%
Mortgage Type
New Conventional
Purchase Details
Closed on
Oct 1, 2011
Sold by
Mao Yejia and Zhao Yong
Bought by
Zhao Yong and Mao Yejia
Home Financials for this Owner
Home Financials are based on the most recent Mortgage that was taken out on this home.
Original Mortgage
$412,000
Interest Rate
4.15%
Mortgage Type
New Conventional
Purchase Details
Closed on
Oct 14, 2010
Sold by
Zhao Yong and Mao Yejia
Bought by
Zhao Yong and Mao Yejia
Home Financials for this Owner
Home Financials are based on the most recent Mortgage that was taken out on this home.
Original Mortgage
$417,000
Interest Rate
4.33%
Mortgage Type
New Conventional
Purchase Details
Closed on
Nov 17, 2009
Sold by
Zhao Yong and Mao Yejia
Bought by
Zhao Yong and Mao Yejia
Purchase Details
Closed on
Mar 1, 2002
Sold by
Pelayo Laureano S and Pelayo Virginia G
Bought by
Zhao Yong and Mao Yejia
Home Financials for this Owner
Home Financials are based on the most recent Mortgage that was taken out on this home.
Original Mortgage
$460,000
Interest Rate
6.62%
Purchase Details
Closed on
Apr 19, 1996
Sold by
Pelayo Laureano S and Pelayo Virginia G
Bought by
Pelayo Laureano S and Pelayo Virginia G
Create a Home Valuation Report for This Property
The Home Valuation Report is an in-depth analysis detailing your home's value as well as a comparison with similar homes in the area
Home Values in the Area
Average Home Value in this Area
Purchase History
| Date | Buyer | Sale Price | Title Company |
|---|---|---|---|
| Zhao Yong | -- | Accommodation | |
| Y N Y Trust | -- | None Listed On Document | |
| Mao Yejia | -- | Wfg National Title | |
| Zhao Yong | -- | Accommodation | |
| Zhao Yong | -- | Chicago Title Company | |
| Mao Yejia | -- | Chicago Title Company | |
| Zhao Yong | -- | Accommodation | |
| Zhao Yong | -- | Accommodation | |
| Zhao Yong | -- | Chicago Title Company | |
| Zhao Yong | -- | None Available | |
| Zhao Yong | $575,000 | Alliance Title Company | |
| Pelayo Laureano S | -- | -- | |
| Pelayo Laureano S | -- | -- |
Source: Public Records
Mortgage History
| Date | Status | Borrower | Loan Amount |
|---|---|---|---|
| Previous Owner | Mao Yejia | $260,000 | |
| Previous Owner | Zhao Yong | $409,000 | |
| Previous Owner | Mao Yejia | $412,000 | |
| Previous Owner | Zhao Yong | $417,000 | |
| Previous Owner | Zhao Yong | $460,000 | |
| Closed | Zhao Yong | $86,250 |
Source: Public Records
Tax History Compared to Growth
Tax History
| Year | Tax Paid | Tax Assessment Tax Assessment Total Assessment is a certain percentage of the fair market value that is determined by local assessors to be the total taxable value of land and additions on the property. | Land | Improvement |
|---|---|---|---|---|
| 2025 | $9,707 | $849,430 | $382,168 | $467,262 |
| 2024 | $9,707 | $832,775 | $374,675 | $458,100 |
| 2023 | $9,675 | $816,447 | $367,329 | $449,118 |
| 2022 | $9,635 | $800,439 | $360,127 | $440,312 |
| 2021 | $9,494 | $784,745 | $353,066 | $431,679 |
| 2020 | $9,328 | $776,699 | $349,446 | $427,253 |
| 2019 | $9,221 | $761,471 | $342,595 | $418,876 |
| 2018 | $8,756 | $746,541 | $335,878 | $410,663 |
| 2017 | $8,642 | $731,904 | $329,293 | $402,611 |
| 2016 | $8,292 | $717,554 | $322,837 | $394,717 |
| 2015 | $8,207 | $706,776 | $317,988 | $388,788 |
| 2014 | $7,987 | $692,933 | $311,760 | $381,173 |
Source: Public Records
Map
Nearby Homes
- 99 Jacklin Ct
- 182 Rose Dr
- 1200 N Abbott Ave Unit 200
- 392 Terra Mesa Way
- 1206 California Cir
- 207 Redwood Ave
- 773 Heflin St
- 1377 California Cir
- 1375 California Cir
- 1000 Jacklin Rd
- 1048 N Abbott Ave
- 1361 Lilac Way
- 1355 Lilac Way
- 1087 N Abbott Ave
- 1830 Vegas Ave
- 1610 Hidden Creek Ln
- 468 Glenmoor Cir
- 60 Wilson Way Unit 171
- 60 Wilson Way Unit 150
- 60 Wilson Way Unit 158
- 1190 Belbrook Way
- 1210 Belbrook Way
- 70 Midwick Dr
- 1182 Belbrook Way
- 36 Midwick Dr
- 82 Midwick Dr
- 1181 Kovanda Way
- 1174 Belbrook Way
- 85 Berrendo Dr
- 1199 Belbrook Way
- 1240 Belbrook Way
- 24 Midwick Dr
- 1191 Belbrook Way
- 1233 Fontainbleu Ave
- 94 Midwick Dr
- 1169 Kovanda Way
- 1183 Belbrook Way
- 1166 Belbrook Way
- 1252 Belbrook Way
- 12 Midwick Dr