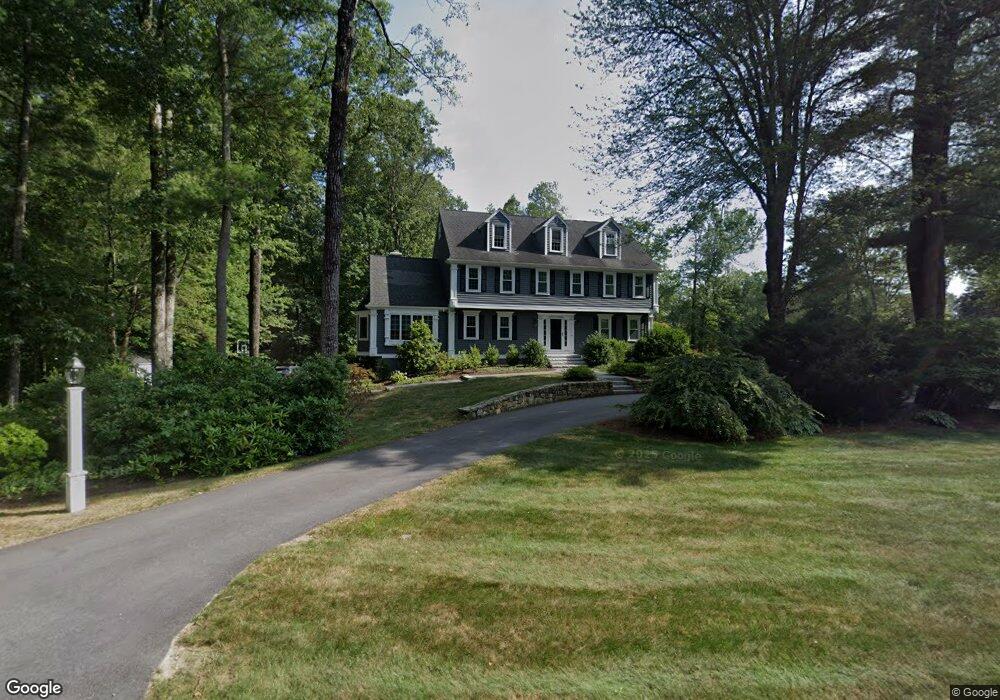
12 Dicarlo Rd Hopkinton, MA 01748
Estimated Value: $1,199,431 - $1,385,000
4
Beds
3
Baths
3,378
Sq Ft
$380/Sq Ft
Est. Value
About This Home
This home is located at 12 Dicarlo Rd, Hopkinton, MA 01748 and is currently estimated at $1,284,358, approximately $380 per square foot. 12 Dicarlo Rd is a home located in Middlesex County with nearby schools including Elmwood Elementary School, Hopkins Elementary School, and Hopkinton Middle School.
Ownership History
Date
Name
Owned For
Owner Type
Purchase Details
Closed on
Sep 11, 2007
Sold by
Hedrick Hunt R
Bought by
Mccabe John P and Mccabe Sharon
Current Estimated Value
Purchase Details
Closed on
Jan 23, 2002
Sold by
Guha Subrata and Guha-Fuller Laura
Bought by
Hedrick Hunt R
Purchase Details
Closed on
Dec 10, 1993
Sold by
Hudnall Kenneth M and Hudnall June B
Bought by
Suha Subrata and Fuller-Guha Laura
Purchase Details
Closed on
Jan 15, 1991
Sold by
Gallery Patrick C and Gallery Rebecca L
Bought by
Hudnall Kenneth M and Hudnall June B
Purchase Details
Closed on
Nov 15, 1988
Sold by
Bradley Edward J
Bought by
Gallery Patrick C
Create a Home Valuation Report for This Property
The Home Valuation Report is an in-depth analysis detailing your home's value as well as a comparison with similar homes in the area
Home Values in the Area
Average Home Value in this Area
Purchase History
| Date | Buyer | Sale Price | Title Company |
|---|---|---|---|
| Mccabe John P | $636,000 | -- | |
| Hedrick Hunt R | $483,500 | -- | |
| Suha Subrata | $310,000 | -- | |
| Hudnall Kenneth M | $286,500 | -- | |
| Gallery Patrick C | $380,000 | -- |
Source: Public Records
Mortgage History
| Date | Status | Borrower | Loan Amount |
|---|---|---|---|
| Open | Gallery Patrick C | $408,000 | |
| Closed | Gallery Patrick C | $70,400 |
Source: Public Records
Tax History Compared to Growth
Tax History
| Year | Tax Paid | Tax Assessment Tax Assessment Total Assessment is a certain percentage of the fair market value that is determined by local assessors to be the total taxable value of land and additions on the property. | Land | Improvement |
|---|---|---|---|---|
| 2025 | $15,059 | $1,062,000 | $417,600 | $644,400 |
| 2024 | $14,815 | $1,014,000 | $397,500 | $616,500 |
| 2023 | $14,049 | $888,600 | $326,500 | $562,100 |
| 2022 | $13,689 | $803,800 | $296,900 | $506,900 |
| 2021 | $13,273 | $777,100 | $288,200 | $488,900 |
| 2020 | $12,649 | $752,000 | $281,200 | $470,800 |
| 2019 | $12,718 | $740,700 | $276,000 | $464,700 |
| 2018 | $10,838 | $641,300 | $262,900 | $378,400 |
| 2017 | $10,492 | $624,500 | $255,300 | $369,200 |
| 2016 | $10,366 | $608,700 | $250,300 | $358,400 |
| 2015 | $10,361 | $576,900 | $242,900 | $334,000 |
Source: Public Records
Map
Nearby Homes