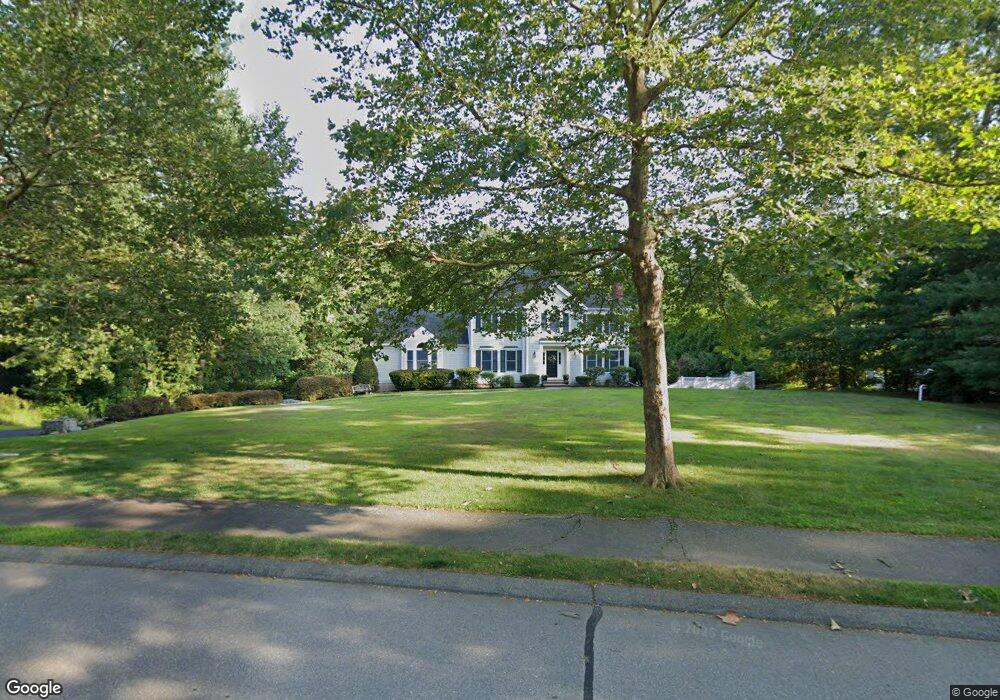
12 Galeucia Rd Middleton, MA 01949
Estimated Value: $1,331,000 - $1,345,761
4
Beds
4
Baths
3,177
Sq Ft
$421/Sq Ft
Est. Value
About This Home
This home is located at 12 Galeucia Rd, Middleton, MA 01949 and is currently estimated at $1,337,690, approximately $421 per square foot. 12 Galeucia Rd is a home located in Essex County with nearby schools including Howe-Manning Elementary School, Fuller Meadow Elementary School, and Masconomet Regional Middle School.
Ownership History
Date
Name
Owned For
Owner Type
Purchase Details
Closed on
Jul 15, 2022
Sold by
Freshman Jay S
Bought by
Rosenbaum Claire E and Rosenbaum Joshua S
Current Estimated Value
Home Financials for this Owner
Home Financials are based on the most recent Mortgage that was taken out on this home.
Original Mortgage
$850,000
Outstanding Balance
$794,490
Interest Rate
3.63%
Mortgage Type
Purchase Money Mortgage
Estimated Equity
$543,200
Purchase Details
Closed on
Nov 21, 2018
Sold by
Freshman Jay S and Freshman Roberta A
Bought by
Freshman Jay S
Purchase Details
Closed on
Apr 25, 1997
Sold by
Woodstone Est Condo
Bought by
Freshman Jay S and Freshman Roberta A
Create a Home Valuation Report for This Property
The Home Valuation Report is an in-depth analysis detailing your home's value as well as a comparison with similar homes in the area
Home Values in the Area
Average Home Value in this Area
Purchase History
| Date | Buyer | Sale Price | Title Company |
|---|---|---|---|
| Rosenbaum Claire E | $1,100,000 | None Available | |
| Rosenbaum Claire E | $1,100,000 | None Available | |
| Rosenbaum Claire E | $1,100,000 | None Available | |
| Freshman Jay S | -- | -- | |
| Freshman Jay S | -- | -- | |
| Freshman Jay S | -- | -- | |
| Freshman Jay S | $160,000 | -- | |
| Freshman Jay S | $160,000 | -- |
Source: Public Records
Mortgage History
| Date | Status | Borrower | Loan Amount |
|---|---|---|---|
| Open | Rosenbaum Claire E | $850,000 | |
| Closed | Rosenbaum Claire E | $850,000 | |
| Previous Owner | Freshman Jay S | $200,000 | |
| Previous Owner | Freshman Jay S | $295,000 |
Source: Public Records
Tax History Compared to Growth
Tax History
| Year | Tax Paid | Tax Assessment Tax Assessment Total Assessment is a certain percentage of the fair market value that is determined by local assessors to be the total taxable value of land and additions on the property. | Land | Improvement |
|---|---|---|---|---|
| 2025 | $16,356 | $1,375,600 | $635,100 | $740,500 |
| 2024 | $15,742 | $1,335,200 | $633,100 | $702,100 |
| 2023 | $15,591 | $1,211,400 | $633,100 | $578,300 |
| 2022 | $11,531 | $870,300 | $355,500 | $514,800 |
| 2021 | $11,883 | $866,100 | $387,200 | $478,900 |
| 2020 | $11,870 | $871,500 | $387,200 | $484,300 |
| 2019 | $11,170 | $815,900 | $341,200 | $474,700 |
| 2018 | $11,181 | $800,900 | $341,200 | $459,700 |
| 2017 | $11,390 | $816,500 | $363,200 | $453,300 |
| 2016 | $10,279 | $740,000 | $293,200 | $446,800 |
| 2015 | $10,613 | $770,200 | $323,200 | $447,000 |
Source: Public Records
Map
Nearby Homes
- 2 Tyler Ln
- 15 Couture Way
- 62 Cabral Dr
- 6 White Ln
- 119 River St
- 1 Mills Point Unit 1
- 8 Brookside Rd
- 28 Niblick Way
- 37 Peaslee Cir Unit 37
- 44 Brassie Way
- 5 Theresa Rd
- 49 Maple St Unit B
- 1466 Main St
- 103 Elm St
- 62 Catherine Dr
- 39 Central St
- 53 N Main St Unit 53
- Beverly Plan at Willis Brook at Lynnfield
- Sutton Plan at Willis Brook at Lynnfield
- Topsfield Plan at Willis Brook at Lynnfield