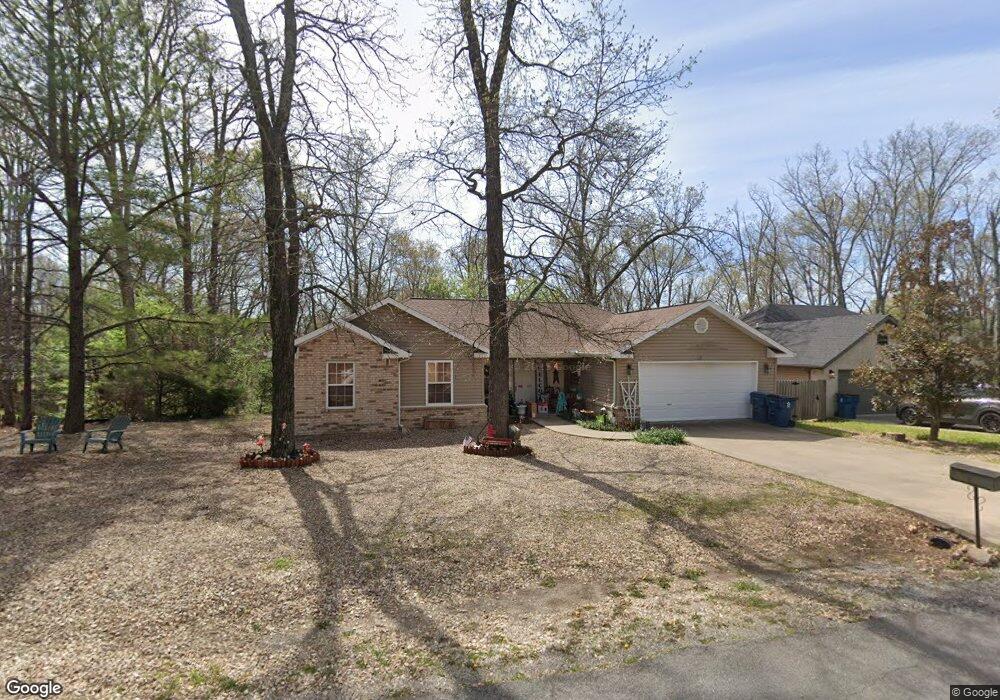
12 Headley Dr Bella Vista, AR 72714
Estimated Value: $297,379 - $342,000
--
Bed
2
Baths
1,424
Sq Ft
$221/Sq Ft
Est. Value
About This Home
This home is located at 12 Headley Dr, Bella Vista, AR 72714 and is currently estimated at $315,095, approximately $221 per square foot. 12 Headley Dr is a home located in Benton County with nearby schools including Sugar Creek Elementary School, Ruth Barker Middle School, and Washington Junior High School.
Ownership History
Date
Name
Owned For
Owner Type
Purchase Details
Closed on
Aug 14, 2007
Sold by
Kinzie Raymond L and Kinzie Mary Jane
Bought by
Stursma Douglas C and Stursma Sandra K
Current Estimated Value
Purchase Details
Closed on
Sep 3, 2004
Bought by
Kinzie
Purchase Details
Closed on
Aug 31, 2004
Bought by
Kinzie
Purchase Details
Closed on
May 12, 2004
Bought by
Seay Const
Purchase Details
Closed on
Feb 11, 2004
Bought by
Seay
Purchase Details
Closed on
Jul 25, 2003
Bought by
Highlands
Purchase Details
Closed on
Apr 28, 2003
Bought by
Bvpoa
Purchase Details
Closed on
Mar 17, 2003
Bought by
Bvpoa
Purchase Details
Closed on
Feb 22, 1990
Bought by
Taege
Purchase Details
Closed on
Dec 13, 1988
Bought by
Cooper
Purchase Details
Closed on
Mar 10, 1986
Bought by
Niederkrome
Create a Home Valuation Report for This Property
The Home Valuation Report is an in-depth analysis detailing your home's value as well as a comparison with similar homes in the area
Home Values in the Area
Average Home Value in this Area
Purchase History
| Date | Buyer | Sale Price | Title Company |
|---|---|---|---|
| Stursma Douglas C | $135,000 | None Available | |
| Kinzie | $128,000 | -- | |
| Kinzie | $128,000 | -- | |
| Seay Const | $5,000 | -- | |
| Seay | $5,000 | -- | |
| Highlands | $1,000 | -- | |
| Bvpoa | -- | -- | |
| Bvpoa | -- | -- | |
| Taege | $8,000 | -- | |
| Cooper | -- | -- | |
| Niederkrome | $8,000 | -- |
Source: Public Records
Tax History Compared to Growth
Tax History
| Year | Tax Paid | Tax Assessment Tax Assessment Total Assessment is a certain percentage of the fair market value that is determined by local assessors to be the total taxable value of land and additions on the property. | Land | Improvement |
|---|---|---|---|---|
| 2025 | $2,385 | $50,538 | $1,600 | $48,938 |
| 2024 | $2,164 | $50,538 | $1,600 | $48,938 |
| 2023 | $1,967 | $33,240 | $800 | $32,440 |
| 2022 | $1,874 | $33,240 | $800 | $32,440 |
| 2021 | $1,714 | $33,240 | $800 | $32,440 |
| 2020 | $1,572 | $24,680 | $600 | $24,080 |
| 2019 | $1,572 | $24,680 | $600 | $24,080 |
| 2018 | $1,572 | $24,680 | $600 | $24,080 |
| 2017 | $1,513 | $24,680 | $600 | $24,080 |
| 2016 | $1,513 | $24,680 | $600 | $24,080 |
| 2015 | $1,445 | $23,960 | $1,000 | $22,960 |
| 2014 | $1,445 | $23,960 | $1,000 | $22,960 |
Source: Public Records
Map
Nearby Homes