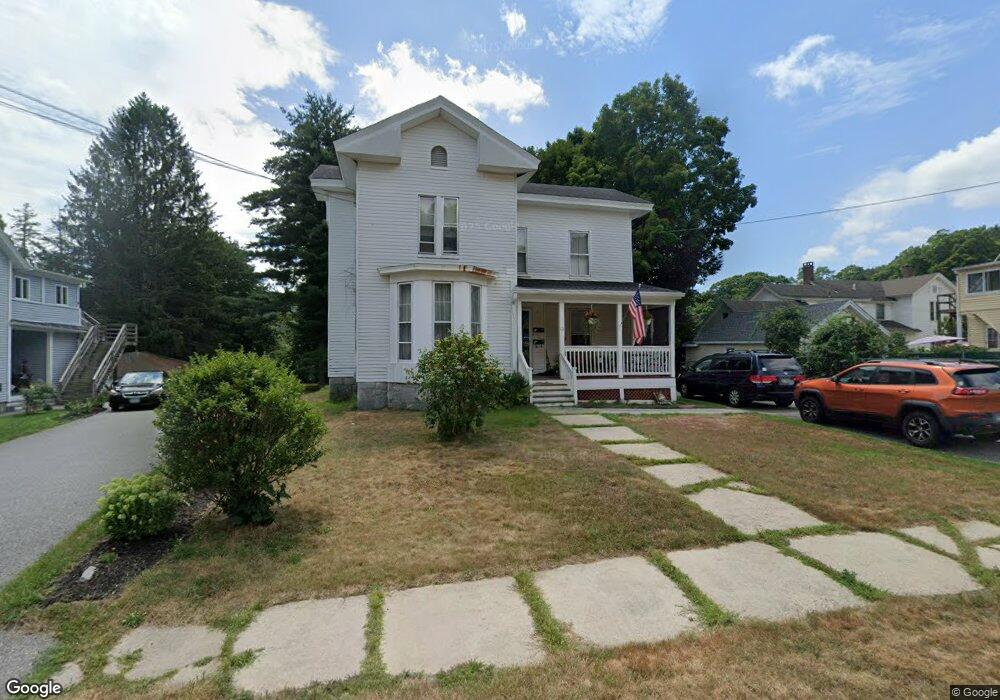
12 Holabird Ave Winsted, CT 06098
Estimated Value: $271,316 - $374,000
6
Beds
2
Baths
2,806
Sq Ft
$112/Sq Ft
Est. Value
About This Home
This home is located at 12 Holabird Ave, Winsted, CT 06098 and is currently estimated at $315,079, approximately $112 per square foot. 12 Holabird Ave is a home located in Litchfield County with nearby schools including Explorations Charter School, St Anthony School, and The Gilbert School.
Ownership History
Date
Name
Owned For
Owner Type
Purchase Details
Closed on
Jun 6, 2002
Sold by
Monda Norma A
Bought by
Remillard Michael J and Eyre Diona K
Current Estimated Value
Purchase Details
Closed on
Sep 26, 1994
Sold by
Citicorp Mtg Inc
Bought by
Monda Norma A
Create a Home Valuation Report for This Property
The Home Valuation Report is an in-depth analysis detailing your home's value as well as a comparison with similar homes in the area
Home Values in the Area
Average Home Value in this Area
Purchase History
| Date | Buyer | Sale Price | Title Company |
|---|---|---|---|
| Remillard Michael J | $135,000 | -- | |
| Remillard Michael J | $135,000 | -- | |
| Monda Norma A | $54,000 | -- | |
| Monda Norma A | $54,000 | -- |
Source: Public Records
Mortgage History
| Date | Status | Borrower | Loan Amount |
|---|---|---|---|
| Closed | Monda Norma A | $15,000 | |
| Closed | Monda Norma A | $130,000 | |
| Closed | Monda Norma A | $128,538 |
Source: Public Records
Tax History Compared to Growth
Tax History
| Year | Tax Paid | Tax Assessment Tax Assessment Total Assessment is a certain percentage of the fair market value that is determined by local assessors to be the total taxable value of land and additions on the property. | Land | Improvement |
|---|---|---|---|---|
| 2025 | $3,759 | $128,870 | $24,780 | $104,090 |
| 2024 | $3,510 | $128,870 | $24,780 | $104,090 |
| 2023 | $3,401 | $128,870 | $24,780 | $104,090 |
| 2022 | $3,188 | $95,060 | $18,130 | $76,930 |
| 2021 | $3,188 | $95,060 | $18,130 | $76,930 |
| 2020 | $4,312 | $95,060 | $18,130 | $76,930 |
| 2019 | $3,833 | $95,060 | $18,130 | $76,930 |
| 2018 | $3,188 | $95,060 | $18,130 | $76,930 |
| 2017 | $3,233 | $96,390 | $18,130 | $78,260 |
| 2016 | $2,937 | $87,570 | $18,130 | $69,440 |
| 2015 | $2,864 | $87,570 | $18,130 | $69,440 |
| 2014 | $2,794 | $87,570 | $18,130 | $69,440 |
Source: Public Records
Map
Nearby Homes