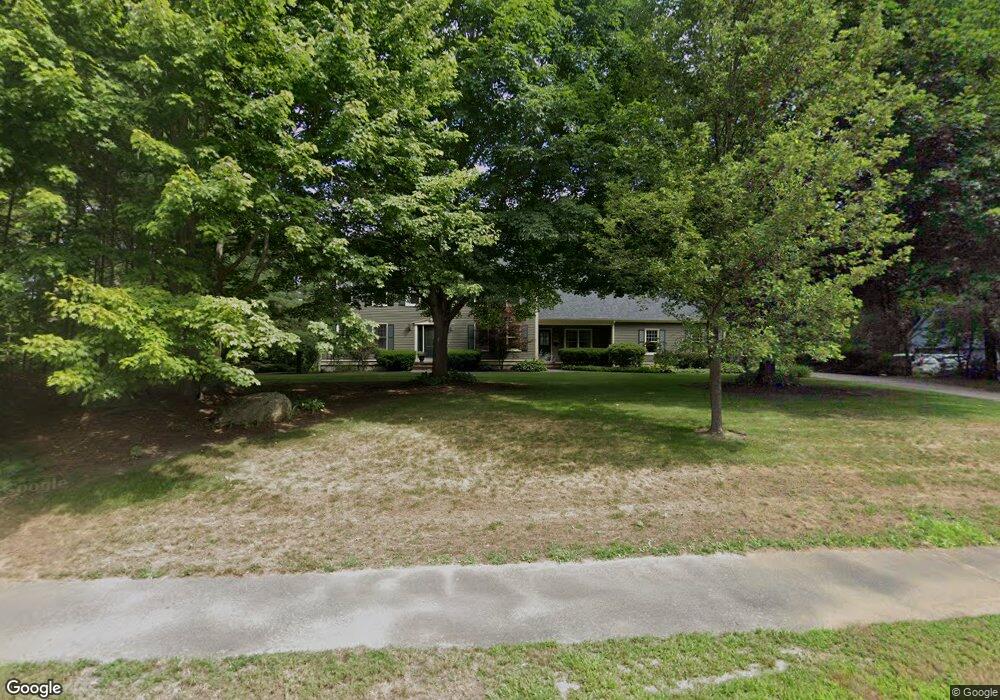
12 Kathryn Rd Foxboro, MA 02035
Estimated Value: $914,000 - $1,509,000
4
Beds
3
Baths
2,718
Sq Ft
$400/Sq Ft
Est. Value
About This Home
This home is located at 12 Kathryn Rd, Foxboro, MA 02035 and is currently estimated at $1,086,162, approximately $399 per square foot. 12 Kathryn Rd is a home located in Norfolk County with nearby schools including Foxborough High School, Foxborough Regional Charter School, and Hands-On-Montessori School.
Ownership History
Date
Name
Owned For
Owner Type
Purchase Details
Closed on
Aug 6, 1993
Sold by
Brookdale Corp
Bought by
Thrasher James D and Thrasher Margaret C
Current Estimated Value
Home Financials for this Owner
Home Financials are based on the most recent Mortgage that was taken out on this home.
Original Mortgage
$203,150
Interest Rate
7.29%
Mortgage Type
Purchase Money Mortgage
Create a Home Valuation Report for This Property
The Home Valuation Report is an in-depth analysis detailing your home's value as well as a comparison with similar homes in the area
Home Values in the Area
Average Home Value in this Area
Purchase History
| Date | Buyer | Sale Price | Title Company |
|---|---|---|---|
| Thrasher James D | $295,000 | -- |
Source: Public Records
Mortgage History
| Date | Status | Borrower | Loan Amount |
|---|---|---|---|
| Closed | Thrasher James D | $40,000 | |
| Closed | Thrasher James D | $30,000 | |
| Closed | Thrasher James D | $203,150 |
Source: Public Records
Tax History Compared to Growth
Tax History
| Year | Tax Paid | Tax Assessment Tax Assessment Total Assessment is a certain percentage of the fair market value that is determined by local assessors to be the total taxable value of land and additions on the property. | Land | Improvement |
|---|---|---|---|---|
| 2025 | $11,106 | $840,100 | $317,000 | $523,100 |
| 2024 | $10,474 | $775,300 | $290,600 | $484,700 |
| 2023 | $10,109 | $711,400 | $277,000 | $434,400 |
| 2022 | $9,723 | $669,600 | $258,700 | $410,900 |
| 2021 | $9,677 | $656,500 | $252,200 | $404,300 |
| 2020 | $9,369 | $643,000 | $252,200 | $390,800 |
| 2019 | $9,457 | $643,300 | $271,200 | $372,100 |
| 2018 | $9,374 | $643,400 | $281,600 | $361,800 |
| 2017 | $9,185 | $610,700 | $272,900 | $337,800 |
| 2016 | $9,089 | $613,300 | $268,200 | $345,100 |
| 2015 | $8,774 | $577,600 | $214,900 | $362,700 |
| 2014 | $8,553 | $570,600 | $214,900 | $355,700 |
Source: Public Records
Map
Nearby Homes
- 406 South St
- 80 Mill St
- 16 Treasure Island Rd
- 450 West St
- 356 Central St
- 12 Spring St
- 277 Central St
- 24 Maverick Dr
- 9 Oak Dr
- 483 Thurston St
- 166 Chauncy St
- 14 Baker St
- 11 W Belcher Rd Unit 2
- 11 Orchard Place Unit 11
- 120 Hawes St
- 24 Mechanic St
- 4 Buckskin Dr
- 84 Cocasset St Unit A6
- 18 Winter St Unit E
- 14 Winter St Unit B