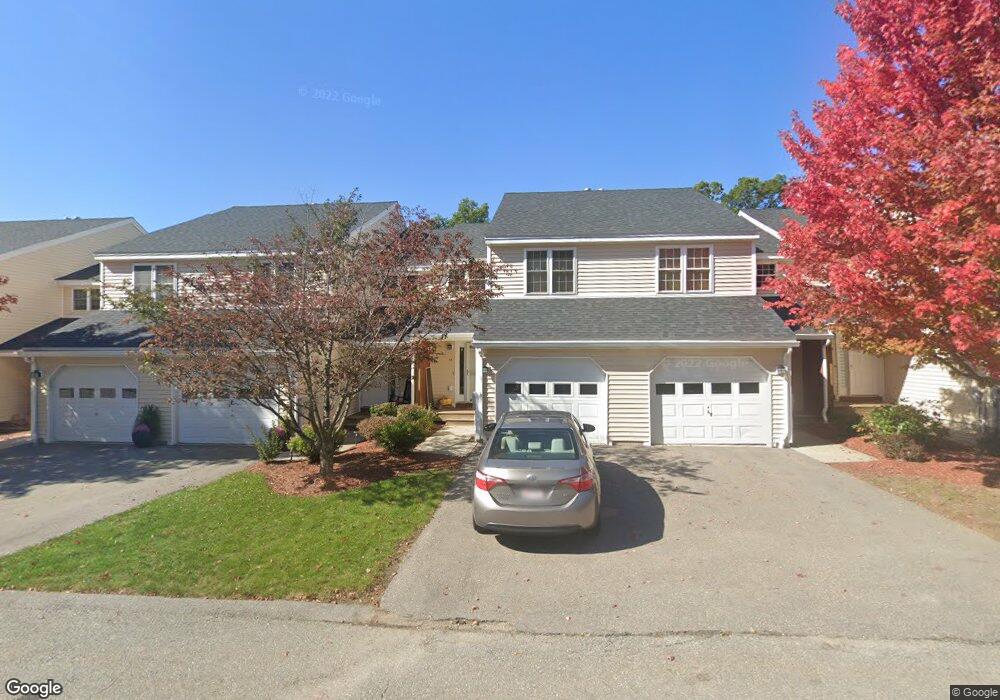
12 Mountain Laurel Ln Fitchburg, MA 01420
Estimated Value: $351,197 - $381,000
2
Beds
2
Baths
1,328
Sq Ft
$275/Sq Ft
Est. Value
About This Home
This home is located at 12 Mountain Laurel Ln, Fitchburg, MA 01420 and is currently estimated at $365,549, approximately $275 per square foot. 12 Mountain Laurel Ln is a home located in Worcester County with nearby schools including Reingold Elementary School, South Street Elementary School, and Crocker Elementary School.
Ownership History
Date
Name
Owned For
Owner Type
Purchase Details
Closed on
Mar 1, 2016
Sold by
Redmond Cynthia
Bought by
Despres Michael E
Current Estimated Value
Home Financials for this Owner
Home Financials are based on the most recent Mortgage that was taken out on this home.
Original Mortgage
$122,500
Outstanding Balance
$97,819
Interest Rate
3.92%
Mortgage Type
New Conventional
Estimated Equity
$267,730
Purchase Details
Closed on
Mar 31, 2008
Sold by
Scalice Melanie K
Bought by
Redmond Cynthia
Purchase Details
Closed on
Jul 27, 2007
Sold by
Alvarez Pilar
Bought by
Scalice Melanie K
Home Financials for this Owner
Home Financials are based on the most recent Mortgage that was taken out on this home.
Original Mortgage
$159,600
Interest Rate
6.78%
Mortgage Type
Purchase Money Mortgage
Purchase Details
Closed on
Oct 7, 2005
Sold by
Evergreen Rt and Sullender Eric W
Bought by
Alvarez Pilar
Create a Home Valuation Report for This Property
The Home Valuation Report is an in-depth analysis detailing your home's value as well as a comparison with similar homes in the area
Home Values in the Area
Average Home Value in this Area
Purchase History
| Date | Buyer | Sale Price | Title Company |
|---|---|---|---|
| Despres Michael E | $157,500 | -- | |
| Redmond Cynthia | $194,000 | -- | |
| Scalice Melanie K | $199,500 | -- | |
| Alvarez Pilar | $195,795 | -- |
Source: Public Records
Mortgage History
| Date | Status | Borrower | Loan Amount |
|---|---|---|---|
| Open | Despres Michael E | $122,500 | |
| Previous Owner | Scalice Melanie K | $159,600 | |
| Previous Owner | Scalice Melanie K | $29,900 |
Source: Public Records
Tax History Compared to Growth
Tax History
| Year | Tax Paid | Tax Assessment Tax Assessment Total Assessment is a certain percentage of the fair market value that is determined by local assessors to be the total taxable value of land and additions on the property. | Land | Improvement |
|---|---|---|---|---|
| 2025 | $42 | $308,800 | $0 | $308,800 |
| 2024 | $4,264 | $287,900 | $0 | $287,900 |
| 2023 | $3,967 | $247,600 | $0 | $247,600 |
| 2022 | $3,927 | $223,000 | $0 | $223,000 |
| 2021 | $3,907 | $205,300 | $0 | $205,300 |
| 2020 | $3,707 | $188,100 | $0 | $188,100 |
| 2019 | $3,655 | $178,400 | $0 | $178,400 |
| 2018 | $3,450 | $164,200 | $0 | $164,200 |
| 2017 | $3,430 | $159,600 | $0 | $159,600 |
| 2016 | $3,365 | $158,500 | $0 | $158,500 |
| 2015 | $3,216 | $155,500 | $0 | $155,500 |
| 2014 | $3,191 | $160,900 | $0 | $160,900 |
Source: Public Records
Map
Nearby Homes
- 7 Green Briar Rd Unit 7
- 34 Oak Leaf Rd
- 15 Cascade St
- 58 Cascade St
- 87 Roosevelt St
- 139 Parson Cir
- 36 Miles St
- 35 Bernadette St
- 53 Alice Ave
- 429 Oak Hill Rd
- 44 Bel Air Dr
- 17 Simonds Rd
- 36 England Ave
- 71 Belgian Way
- 1317 Westminster St
- 19 Ashburnham St
- 162 Delisle St
- 166 Caspian Way
- 48 Belgian Way
- 16 Caspian Way
- 8 Mountain Laurel Ln
- 18 Mountain Laurel Ln
- 14 Mountain Laurel Ln
- 12 Mountain Laurel Ln Unit 20
- 12 Mountain Laurel Ln Unit 12
- 6 Mountain Laurel Ln
- 20 Mountain Laurel Ln
- 16 Mountain Laurel Ln
- 20 Mountain Laurel Ln Unit 24
- 10 Mountain Laurel Ln
- 10 Mountain Laurel Ln Unit 10
- 37 Acorn Ave
- 37 Acorn Ave Unit 37
- 31 Acorn Ave
- 40 Mountain Laurel Ln
- 36 Mountain Laurel Ln
- 34 Mountain Laurel Ln
- 28 Mountain Laurel Ln
- 40 Mountain Laurel Ln Unit 40
- 38 Mountain Laurel Ln