NOT LISTED FOR SALE

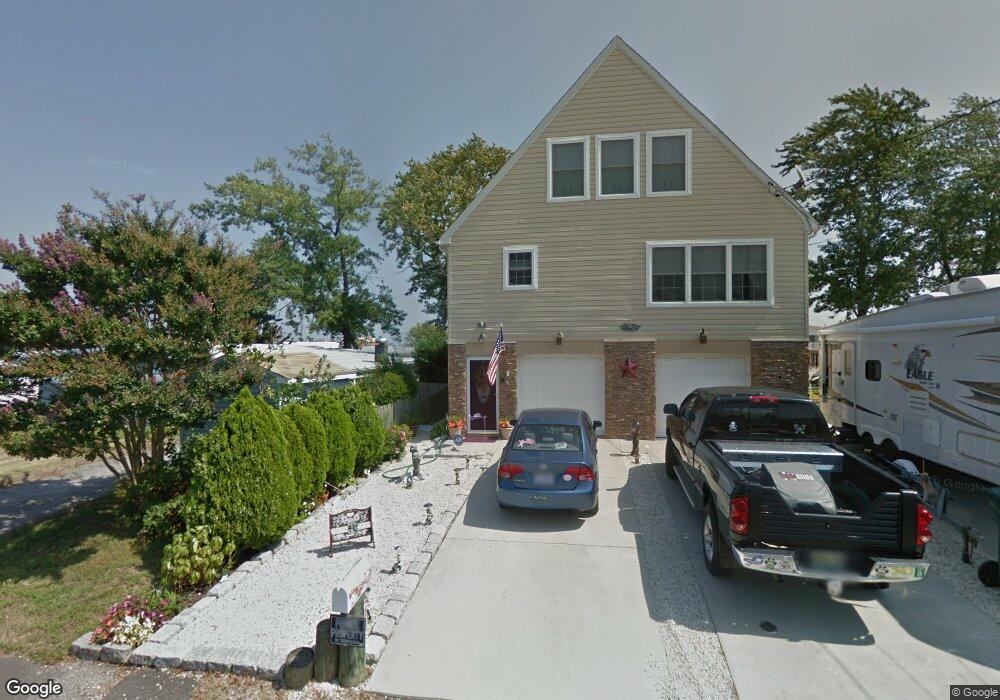
Estimated Value: $356,000 - $388,000

2 Beds
1 Bath
830 Sq Ft
$446/Sq Ft Est. Value

Last Sold April 20, 2014

Last sale price $81,000 $98 Per Sq Ft

Est. 357% increase in value since last sale

Current estimated payment $2,301/month

About This Home

CORPORATE OWNED! Property being sold ''as-is'' and is subject to Hud Guidelines 24 CFR 206.125. Buyer responsible for certificate of occupancy & certifications and inspections. Information from sources deemed reliable but not guaranteed. Buyer to verify all information before placing an offer. No sellers disclosure available. Corporate addendums to follow accepted agreement of sale. Any and all certs, co's, utility activations and u & o's are a responsibility of the buyer.

Ownership History

Date Name Owned For Owner Type

Purchase Details

Listed on
Mar 18, 2014
Closed on
Mar 31, 2014
Sold by
Wells Fargo Bank Na
Bought by
Nugent Todd and Nugent Susan
Seller's Agent
Charlenia Owens
Global Elite Realty Inc.
Buyer's Agent
Charlenia Owens
Global Elite Realty Inc.
Sold Price
$81,000
Current Estimated Value
$370,482

Home Financials for this Owner

Home Financials are based on the most recent Mortgage that was taken out on this home.
Estimated Appreciation
$289,482
Avg. Annual Appreciation
14.09%

Purchase Details

Closed on
Apr 24, 2013
Sold by
Murphy Benedict J and Murphy Loretta G
Bought by
Wells Fargo Bank Na
Source: Public Records

Range of Values:

Collateral Analytics

Collateral Analytics Collateral Analytics AVMs (Automated Valuation Model) employ a number of statistical approaches combined with neighborhood-specific comparable selection guarantees the most up-to-date and precise valuations.

Not Available

Collateral Analytics does not have data for the current month. Please view the chart for historical values.

ICE

ICE Mortgage Technology ICE Mortgage Technology’s AVM (Automated Valuation Model) is a state-of-the-art online residential property valuation tool that provides a quick and accurate estimate of the value of almost any home in the U.S.

Not Available

ICE Mortgage Technology does not have data for the current month. Please view the chart for historical values.

First American

First American First American Data & Analytics’ next-generation AVM combines unrivaled data assets with a blended ensemble of valuation models to produce highly accurate, reliable valuations you can trust.

Not Available

First American does not have data for the current month. Please view the chart for historical values.

Quantarium

Quantarium Quantarium’s valuation service, repeatedly proven the industry’s most accurate and comprehensive, is supercharged with a self-learning and auto-tuning AI engine that continually becomes smarter and more accurate as it processes daily inputs from the industry’s leading RE data lake.

Not Available

Quantarium does not have data for the current month. Please view the chart for historical values.

Average Value
Not Available
List Price
Sold Price
Create a Home Valuation Report for This Property
The Home Valuation Report is an in-depth analysis detailing your home's value as well as a comparison with similar homes in the area

Home Values in the Area

Source: Public Records

Average Home Value in this Area


Source: Public Records

Purchase History

Date Buyer Sale Price Title Company
Nugent Todd $81,000 --
Wells Fargo Bank Na $532,500 None Available
Source: Public Records

Property History

Date Event Price List to Sale Price per Sq Ft Prior Sale
04/20/2014 04/20/14 Sold $81,000 -- $98 / Sq Ft View Prior Sale

Tax History Compared to Growth

Source: Public Records

Tax History

Year Tax Paid Tax Assessment Tax Assessment Total Assessment is a certain percentage of the fair market value that is determined by local assessors to be the total taxable value of land and additions on the property. Land Improvement
2025 $4,335 $146,300 $80,800 $65,500
2024 $4,153 $146,300 $80,800 $65,500
2023 $4,023 $146,300 $80,800 $65,500
2022 $4,023 $146,300 $80,800 $65,500
2021 $3,928 $146,300 $80,800 $65,500
2020 $3,877 $146,300 $80,800 $65,500
2019 $3,720 $146,300 $80,800 $65,500
2018 $3,508 $146,300 $80,800 $65,500
2017 $3,454 $146,300 $80,800 $65,500
2016 $3,482 $146,300 $80,800 $65,500
2015 $3,524 $146,300 $80,800 $65,500
2014 $4,560 $238,600 $210,000 $28,600
Source: Public Records

Agents Affiliated with this Home

See All Agents

Map