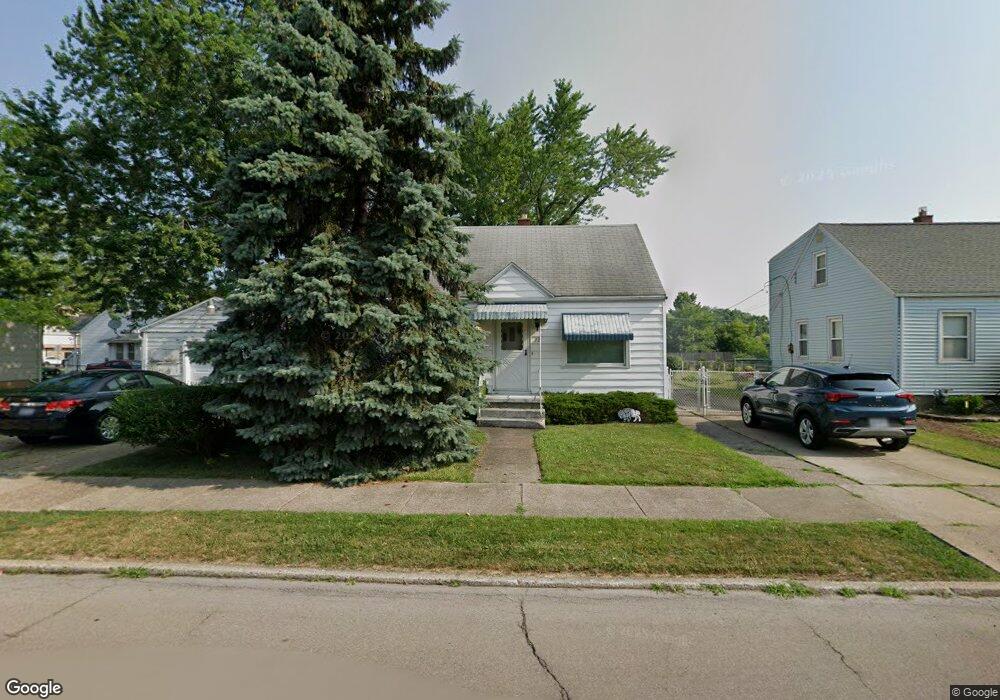
12 Tussing Ln Tonawanda, NY 14150
Estimated Value: $202,000 - $247,000
2
Beds
1
Bath
1,008
Sq Ft
$221/Sq Ft
Est. Value
About This Home
This home is located at 12 Tussing Ln, Tonawanda, NY 14150 and is currently estimated at $222,570, approximately $220 per square foot. 12 Tussing Ln is a home located in Erie County with nearby schools including Mullen Elementary School, Tonawanda Elementary School, and Tonawanda Middle High School.
Ownership History
Date
Name
Owned For
Owner Type
Purchase Details
Closed on
Feb 7, 2024
Sold by
Miller Josephine P and Miller Allen Herman
Bought by
Border Sharon and Miller Kenneth
Current Estimated Value
Purchase Details
Closed on
Jul 13, 2006
Sold by
Schultz Frank T and Whetstone Jean E
Bought by
Schultz Frank T and Schultz Judith
Purchase Details
Closed on
Feb 28, 2005
Sold by
Bertola Mary J and Tricoli Susan M
Bought by
Bertola Mary J and Tricoli Susan M
Purchase Details
Closed on
Dec 13, 2004
Sold by
Messana Anthony Grant and Messana Anthony Ignatius
Bought by
Bright Noel and Bright Roxanne
Purchase Details
Closed on
Aug 12, 2004
Sold by
Long Lawrence J and Long Edwin J
Bought by
Stranahan Daniel M and Stranahan Angela E
Purchase Details
Closed on
Sep 10, 2003
Sold by
Little Mildred L
Bought by
Little Mildred L
Purchase Details
Closed on
Mar 18, 2002
Sold by
Davide James S
Bought by
Davide Angela P
Purchase Details
Closed on
May 23, 2000
Sold by
Hepner Lloyd C and Hepner Frances H
Bought by
Bown Brenda A and Frances H Hepner Irrevocable Trust
Create a Home Valuation Report for This Property
The Home Valuation Report is an in-depth analysis detailing your home's value as well as a comparison with similar homes in the area
Home Values in the Area
Average Home Value in this Area
Purchase History
| Date | Buyer | Sale Price | Title Company |
|---|---|---|---|
| Border Sharon | -- | None Available | |
| Border Sharon | -- | None Available | |
| Schultz Frank T | -- | None Available | |
| Bertola Mary J | -- | -- | |
| Bright Noel | $76,000 | -- | |
| Stranahan Daniel M | $74,500 | -- | |
| Little Mildred L | -- | -- | |
| Davide Angela P | -- | -- | |
| Bown Brenda A | -- | -- |
Source: Public Records
Tax History Compared to Growth
Tax History
| Year | Tax Paid | Tax Assessment Tax Assessment Total Assessment is a certain percentage of the fair market value that is determined by local assessors to be the total taxable value of land and additions on the property. | Land | Improvement |
|---|---|---|---|---|
| 2024 | $1,909 | $151,000 | $14,600 | $136,400 |
| 2023 | $266 | $151,000 | $14,600 | $136,400 |
| 2022 | $1,846 | $98,000 | $15,400 | $82,600 |
| 2021 | $1,838 | $98,000 | $15,400 | $82,600 |
| 2020 | $571 | $98,000 | $15,400 | $82,600 |
| 2019 | $1,313 | $98,000 | $15,400 | $82,600 |
| 2018 | $552 | $98,000 | $15,400 | $82,600 |
| 2017 | $182 | $80,000 | $15,000 | $65,000 |
| 2016 | $296 | $80,000 | $15,000 | $65,000 |
| 2015 | -- | $80,000 | $15,000 | $65,000 |
| 2014 | -- | $80,000 | $15,000 | $65,000 |
Source: Public Records
Map
Nearby Homes