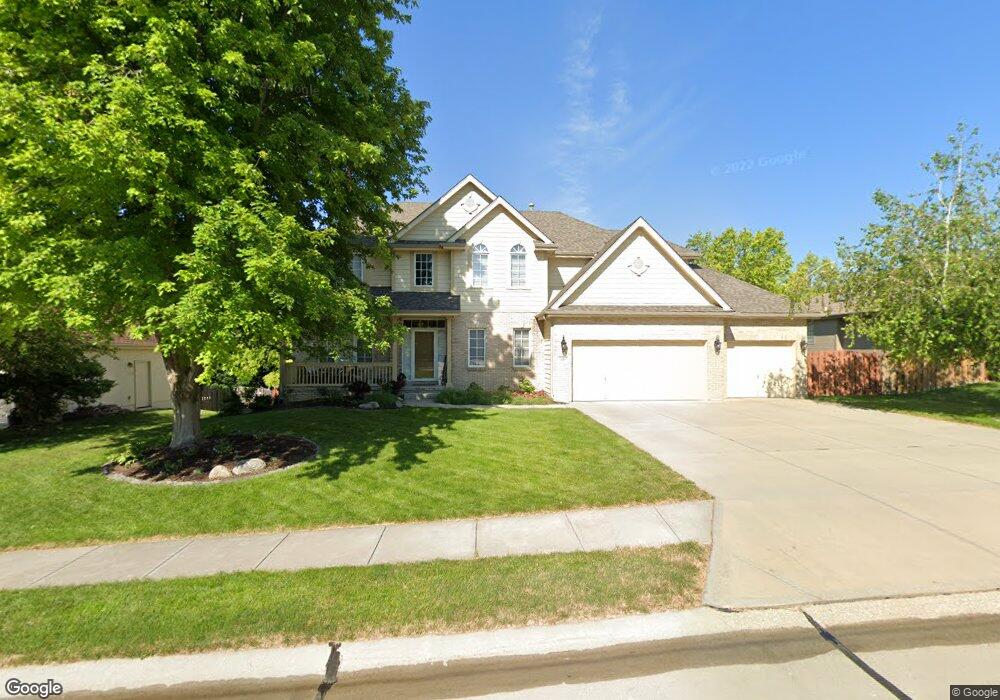
120 Oakmont Dr Papillion, NE 68133
Estimated Value: $530,769 - $589,000
5
Beds
6
Baths
4,007
Sq Ft
$140/Sq Ft
Est. Value
About This Home
This home is located at 120 Oakmont Dr, Papillion, NE 68133 and is currently estimated at $561,192, approximately $140 per square foot. 120 Oakmont Dr is a home located in Sarpy County with nearby schools including Rumsey Station Elementary School, La Vista Middle School, and Papillion La Vista Senior High School.
Ownership History
Date
Name
Owned For
Owner Type
Purchase Details
Closed on
Sep 30, 2006
Sold by
Solomon Bridget B and Solomon Craig H
Bought by
Lyle Edward R and Lyle Kelly A
Current Estimated Value
Home Financials for this Owner
Home Financials are based on the most recent Mortgage that was taken out on this home.
Original Mortgage
$272,000
Outstanding Balance
$161,499
Interest Rate
6.37%
Estimated Equity
$399,693
Purchase Details
Closed on
Aug 31, 2004
Sold by
East Construction Inc
Bought by
Solomon Bridget B and Solomon Craig H
Home Financials for this Owner
Home Financials are based on the most recent Mortgage that was taken out on this home.
Original Mortgage
$215,000
Interest Rate
5.95%
Purchase Details
Closed on
Apr 9, 2004
Sold by
Eagle Ridge Development Co
Bought by
East Construction Inc
Create a Home Valuation Report for This Property
The Home Valuation Report is an in-depth analysis detailing your home's value as well as a comparison with similar homes in the area
Home Values in the Area
Average Home Value in this Area
Purchase History
| Date | Buyer | Sale Price | Title Company |
|---|---|---|---|
| Lyle Edward R | $340,000 | Nlta | |
| Solomon Bridget B | $346,000 | -- | |
| East Construction Inc | $47,000 | -- |
Source: Public Records
Mortgage History
| Date | Status | Borrower | Loan Amount |
|---|---|---|---|
| Open | Lyle Edward R | $272,000 | |
| Closed | Solomon Bridget B | $215,000 |
Source: Public Records
Tax History Compared to Growth
Tax History
| Year | Tax Paid | Tax Assessment Tax Assessment Total Assessment is a certain percentage of the fair market value that is determined by local assessors to be the total taxable value of land and additions on the property. | Land | Improvement |
|---|---|---|---|---|
| 2025 | $7,668 | $532,188 | $68,000 | $464,188 |
| 2024 | $8,657 | $512,401 | $68,000 | $444,401 |
| 2023 | $8,657 | $459,758 | $64,000 | $395,758 |
| 2022 | $8,476 | $415,327 | $56,000 | $359,327 |
| 2021 | $7,932 | $381,022 | $56,000 | $325,022 |
| 2020 | $8,003 | $380,598 | $50,000 | $330,598 |
| 2019 | $7,721 | $367,380 | $50,000 | $317,380 |
| 2018 | $8,016 | $350,378 | $46,000 | $304,378 |
| 2017 | $7,806 | $341,398 | $46,000 | $295,398 |
| 2016 | $7,757 | $338,682 | $46,000 | $292,682 |
| 2015 | $7,586 | $330,983 | $46,000 | $284,983 |
| 2014 | $7,570 | $322,350 | $46,000 | $276,350 |
| 2012 | -- | $326,516 | $46,000 | $280,516 |
Source: Public Records
Map
Nearby Homes
- 2124 Betsy Ave
- 401 Castle Pine Dr
- 605 Ruby Rd
- 2115 Skyhawk Ave
- 2001 Liberty Ln
- 703 Tupelo Ln
- 2207 Kara Dr
- 2110 Aberdeen Plaza
- 2608 Alexandra Rd
- 109 Summerset Cir
- 11308 S 47th St
- 6211 Harvest Dr
- 5903 Longview St
- 6215 Harvest Dr
- 6219 Harvest Dr
- 6223 Harvest Dr
- 6227 Harvest Dr
- 6212 Harvest Dr
- 6216 Harvest Dr
- 6220 Harvest Dr
- 122 Oakmont Dr
- 118 Oakmont Dr
- 119 Allison Ave
- 121 Allison Ave
- 117 Allison Ave
- 124 Oakmont Dr
- 125 Oakmont Plaza
- 123 Allison Ave
- 115 Allison Ave
- 127 Oakmont Dr
- 125 Allison Dr
- 125 Allison Ave
- 119 Oakmont Plaza
- 126 Oakmont Dr
- 123 Oakmont Plaza
- 129 Oakmont Dr
- 120 Allison Ave
- 122 Allison Ave
- 121 Oakmont Plaza
- 118 Allison Ave