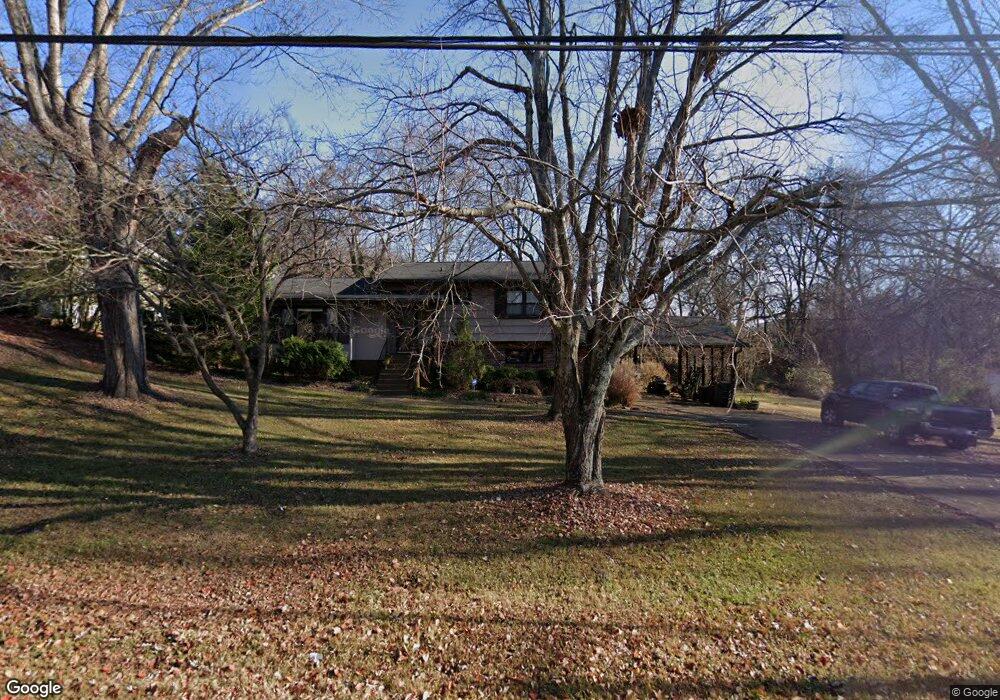
120 Tower Dr Knoxville, TN 37912
Uptown Knoxville NeighborhoodEstimated Value: $284,000 - $318,000
3
Beds
2
Baths
1,692
Sq Ft
$180/Sq Ft
Est. Value
About This Home
This home is located at 120 Tower Dr, Knoxville, TN 37912 and is currently estimated at $304,323, approximately $179 per square foot. 120 Tower Dr is a home located in Knox County with nearby schools including Sterchi Elementary School, Gresham Middle School, and Central High School.
Ownership History
Date
Name
Owned For
Owner Type
Purchase Details
Closed on
Sep 29, 2009
Sold by
Hood Scott D and Hood Stephanie
Bought by
Cruze Brandon A and Cruze Melody
Current Estimated Value
Home Financials for this Owner
Home Financials are based on the most recent Mortgage that was taken out on this home.
Original Mortgage
$132,456
Outstanding Balance
$86,624
Interest Rate
5.11%
Mortgage Type
FHA
Estimated Equity
$217,699
Purchase Details
Closed on
Jan 18, 2005
Sold by
Lee Michael S
Bought by
Hood Scott D
Home Financials for this Owner
Home Financials are based on the most recent Mortgage that was taken out on this home.
Original Mortgage
$77,600
Interest Rate
5%
Mortgage Type
Purchase Money Mortgage
Purchase Details
Closed on
Mar 14, 2002
Sold by
Robinson George E and Ayers Amy A
Bought by
Lee Michael S
Home Financials for this Owner
Home Financials are based on the most recent Mortgage that was taken out on this home.
Original Mortgage
$84,333
Interest Rate
6.85%
Purchase Details
Closed on
Jun 2, 1994
Sold by
Paylor Dorothy D
Bought by
Ayers Amy A
Create a Home Valuation Report for This Property
The Home Valuation Report is an in-depth analysis detailing your home's value as well as a comparison with similar homes in the area
Home Values in the Area
Average Home Value in this Area
Purchase History
| Date | Buyer | Sale Price | Title Company |
|---|---|---|---|
| Cruze Brandon A | $134,900 | Lincoln Title Llc | |
| Hood Scott D | $97,000 | Title Professionals Inc | |
| Lee Michael S | $85,000 | -- | |
| Ayers Amy A | $69,500 | -- |
Source: Public Records
Mortgage History
| Date | Status | Borrower | Loan Amount |
|---|---|---|---|
| Open | Cruze Brandon A | $132,456 | |
| Previous Owner | Hood Scott D | $77,600 | |
| Previous Owner | Lee Michael S | $84,333 | |
| Closed | Hood Scott D | $14,695 |
Source: Public Records
Tax History Compared to Growth
Tax History
| Year | Tax Paid | Tax Assessment Tax Assessment Total Assessment is a certain percentage of the fair market value that is determined by local assessors to be the total taxable value of land and additions on the property. | Land | Improvement |
|---|---|---|---|---|
| 2024 | $1,340 | $36,125 | $0 | $0 |
| 2023 | $1,340 | $36,125 | $0 | $0 |
| 2022 | $1,340 | $36,125 | $0 | $0 |
| 2021 | $1,397 | $30,475 | $0 | $0 |
| 2020 | $1,397 | $30,475 | $0 | $0 |
| 2019 | $1,397 | $30,475 | $0 | $0 |
| 2018 | $1,397 | $30,475 | $0 | $0 |
| 2017 | $1,397 | $30,475 | $0 | $0 |
| 2016 | $1,618 | $0 | $0 | $0 |
| 2015 | $1,618 | $0 | $0 | $0 |
| 2014 | $1,618 | $0 | $0 | $0 |
Source: Public Records
Map
Nearby Homes
- 421 Oakcrest Rd
- 408 Oakcrest Rd
- 5704 Lutie Rd
- 5701 Central Avenue Pike
- 509 Cedar Ln
- 207 N Laurel Cir
- 847 Sterchi Park Way Unit H847
- 603 Henrietta Dr
- 209 S Laurel Cir
- 5616 Davida Rd NW
- 5915 Nature Ln
- 4901 Coy Way
- 509 Highland Dr
- 715 Cedar Ln Unit 118
- 715 Cedar Ln Unit 129
- 724 Graham Way Unit 121
- 6005 Stratford Park Blvd
- 805 Cedar Ln Unit C10
- 5706 Wallwood Rd
- 747 High Point Way Unit 22