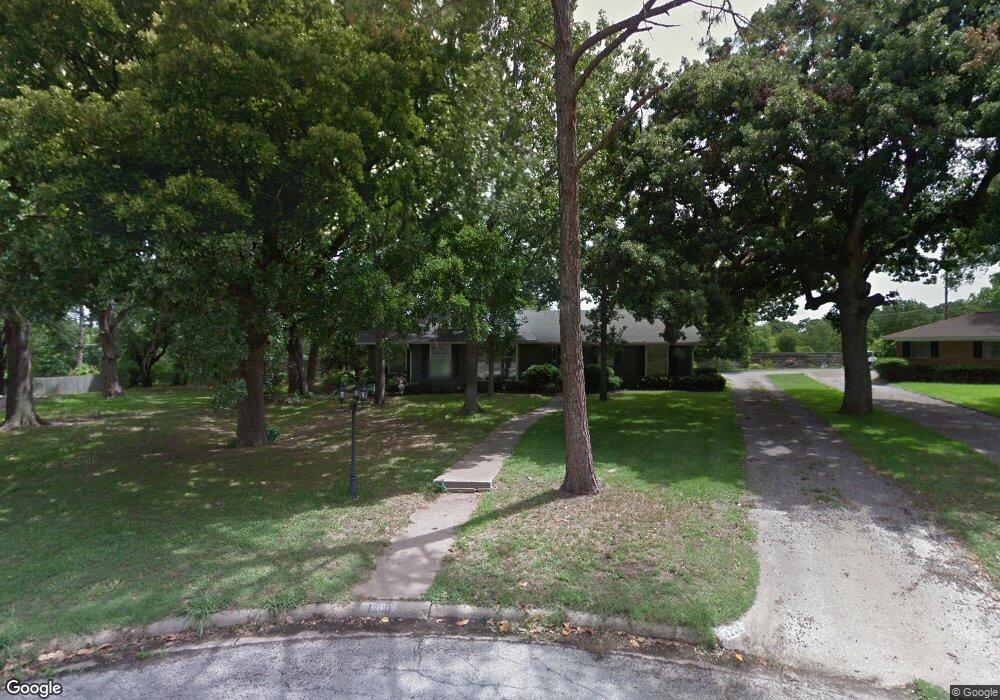
1200 Belmont Cir Corsicana, TX 75110
Estimated Value: $281,000 - $338,000
3
Beds
2
Baths
2,474
Sq Ft
$124/Sq Ft
Est. Value
About This Home
This home is located at 1200 Belmont Cir, Corsicana, TX 75110 and is currently estimated at $307,047, approximately $124 per square foot. 1200 Belmont Cir is a home located in Navarro County with nearby schools including Corsicana High School and William Tyndale Christian Academy.
Ownership History
Date
Name
Owned For
Owner Type
Purchase Details
Closed on
Apr 28, 2017
Sold by
Jones David E and Jones Phyllis
Bought by
Jones Hayden and Jones Taylor
Current Estimated Value
Home Financials for this Owner
Home Financials are based on the most recent Mortgage that was taken out on this home.
Original Mortgage
$153,000
Outstanding Balance
$127,631
Interest Rate
4.3%
Mortgage Type
New Conventional
Estimated Equity
$179,416
Purchase Details
Closed on
Dec 4, 2012
Sold by
Cain Rebecca and Cain Lauren Rebecca
Bought by
Cain Frederick A
Purchase Details
Closed on
May 29, 2009
Sold by
Dawson Jimmy D and Dawson Ruth E
Bought by
Cain Frederick A and Cain Rebecca
Home Financials for this Owner
Home Financials are based on the most recent Mortgage that was taken out on this home.
Original Mortgage
$185,000
Interest Rate
4.76%
Mortgage Type
New Conventional
Create a Home Valuation Report for This Property
The Home Valuation Report is an in-depth analysis detailing your home's value as well as a comparison with similar homes in the area
Home Values in the Area
Average Home Value in this Area
Purchase History
| Date | Buyer | Sale Price | Title Company |
|---|---|---|---|
| Jones Hayden | -- | None Available | |
| Cain Frederick A | -- | None Available | |
| Cain Frederick A | -- | -- |
Source: Public Records
Mortgage History
| Date | Status | Borrower | Loan Amount |
|---|---|---|---|
| Open | Jones Hayden | $153,000 | |
| Closed | Cain Frederick A | $185,000 |
Source: Public Records
Tax History Compared to Growth
Tax History
| Year | Tax Paid | Tax Assessment Tax Assessment Total Assessment is a certain percentage of the fair market value that is determined by local assessors to be the total taxable value of land and additions on the property. | Land | Improvement |
|---|---|---|---|---|
| 2025 | $4,884 | $257,946 | $92,580 | $213,700 |
| 2024 | $4,440 | $234,496 | $85,460 | $230,520 |
| 2023 | $3,589 | $213,178 | $85,460 | $228,660 |
| 2022 | $4,487 | $202,300 | $28,490 | $173,810 |
| 2021 | $4,580 | $176,180 | $28,490 | $147,690 |
| 2020 | $4,638 | $174,780 | $28,490 | $146,290 |
| 2019 | $4,689 | $170,730 | $28,490 | $142,240 |
| 2018 | $4,689 | $170,730 | $28,490 | $142,240 |
| 2017 | $4,670 | $170,270 | $28,490 | $141,780 |
| 2016 | $4,769 | $173,890 | $28,490 | $145,400 |
| 2015 | -- | $169,850 | $28,490 | $141,360 |
| 2014 | -- | $169,850 | $28,490 | $141,360 |
Source: Public Records
Map
Nearby Homes
- 1424 Bowie Dr
- 1313 Columbia Ave
- 1301 Ficklin Ave
- 1235 Lexington Square
- 1531 Magnolia Ave
- 1601 Arlington Dr
- 1527 Columbia Ave
- 1906 Mimosa Dr
- 1708 N 26th St
- 1700 Jennifer Cir
- 1111 Governors Dr
- 2000 Cumberland Cir
- 1501 Sycamore Ave
- TBD Lot 56 Northwest Ave
- 1808 Maplewood Ave
- 2005 Cumberland Cir
- 2110 Dartmouth Ln
- 800 Imperial Ln
- Lot 9B Cumberland Dr
- 1917 Elmwood Ave
- 1212 Belmont Cir
- 1203 Belmont Cir
- 1207 Belmont Cir
- 1220 Belmont Cir
- 1215 Belmont Cir
- 1500 Fairoaks Dr
- 1505 N 22nd St
- 1501 N 22nd St
- 1209 Columbia Cir
- 1200 Columbia Cir
- 1424 N 22nd St
- 1502 Fairoaks Dr
- 1509 N 22nd St
- 1320 N 22nd St
- 1510 N 22nd St
- 1501 Fairoaks Dr
- 1503 Fairoaks Dr
- 1322 N 22nd St
- 000 E Beverly Dr
- 1512 N 22nd St