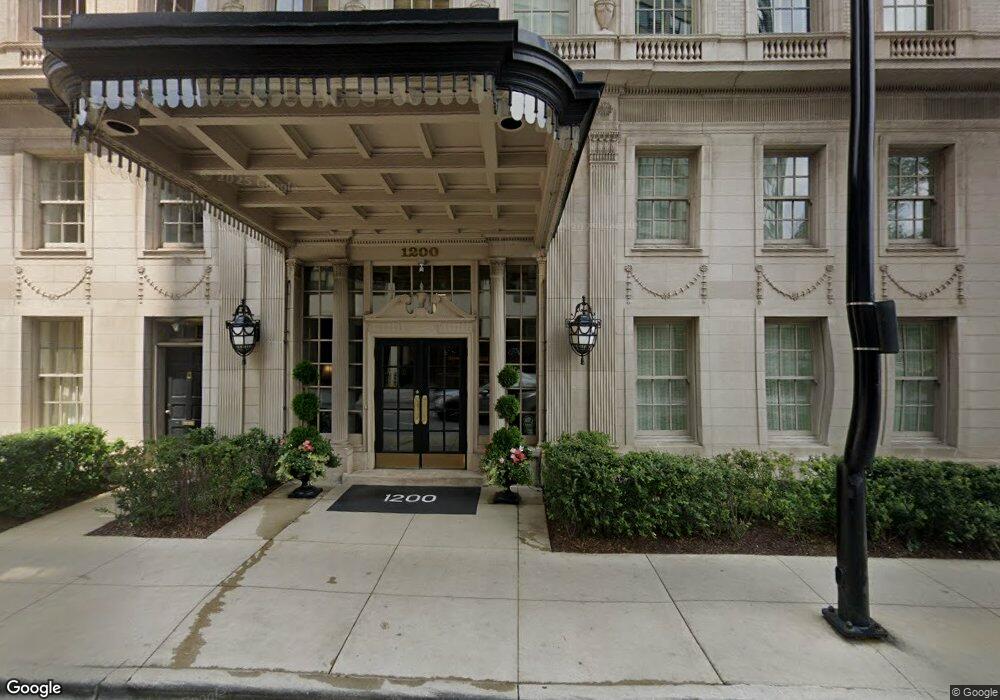
1200 Condominiums 1200 N Lake Shore Dr Unit 1101 Chicago, IL 60610
Gold Coast NeighborhoodEstimated Value: $692,000 - $896,896
--
Bed
--
Bath
--
Sq Ft
9,322
Sq Ft Lot
About This Home
This home is located at 1200 N Lake Shore Dr Unit 1101, Chicago, IL 60610 and is currently estimated at $792,974. 1200 N Lake Shore Dr Unit 1101 is a home located in Cook County with nearby schools including Ogden Elementary School, Lincoln Park High School, and Frances Xavier Warde School.
Ownership History
Date
Name
Owned For
Owner Type
Purchase Details
Closed on
Jan 7, 2020
Sold by
Knoblauch Loring W and Knoblauch Carol E
Bought by
Knoblauch Loring W and Knoblauch Carol E
Current Estimated Value
Purchase Details
Closed on
Dec 12, 2005
Sold by
Knoblauch Loring W and Knoblauch Carol E
Bought by
Knoblauch Loring W and Knoblauch Carol E
Purchase Details
Closed on
Apr 22, 2003
Sold by
Dimatteo Mary Ellen
Bought by
Knoblauch Loring W and Knoblauch Carol E
Purchase Details
Closed on
Mar 30, 2001
Sold by
Mcfarland Leslie W
Bought by
Dimatteo Mary Ellen
Purchase Details
Closed on
Jan 28, 1994
Sold by
Marsh Charles A and Marsh Catherine C
Bought by
Purdy Thomas K and Baldwin Taylor A
Home Financials for this Owner
Home Financials are based on the most recent Mortgage that was taken out on this home.
Original Mortgage
$781,875
Interest Rate
7.31%
Create a Home Valuation Report for This Property
The Home Valuation Report is an in-depth analysis detailing your home's value as well as a comparison with similar homes in the area
Home Values in the Area
Average Home Value in this Area
Purchase History
| Date | Buyer | Sale Price | Title Company |
|---|---|---|---|
| Knoblauch Loring W | -- | None Available | |
| Knoblauch Loring W | -- | -- | |
| Knoblauch Loring W | $2,200,000 | Cti | |
| Knoblauch Loring W | $2,200,000 | Cti | |
| Dimatteo Mary Ellen | $2,225,000 | -- | |
| Purdy Thomas K | $695,000 | -- |
Source: Public Records
Mortgage History
| Date | Status | Borrower | Loan Amount |
|---|---|---|---|
| Previous Owner | Purdy Thomas K | $781,875 |
Source: Public Records
Tax History Compared to Growth
Tax History
| Year | Tax Paid | Tax Assessment Tax Assessment Total Assessment is a certain percentage of the fair market value that is determined by local assessors to be the total taxable value of land and additions on the property. | Land | Improvement |
|---|---|---|---|---|
| 2024 | $11,932 | $57,973 | $6,364 | $51,609 |
| 2023 | $11,593 | $62,520 | $5,124 | $57,396 |
| 2022 | $11,593 | $62,520 | $5,124 | $57,396 |
| 2021 | $12,066 | $65,999 | $5,124 | $60,875 |
| 2020 | $8,563 | $44,025 | $3,587 | $40,438 |
| 2019 | $8,358 | $47,775 | $3,587 | $44,188 |
| 2018 | $8,216 | $47,775 | $3,587 | $44,188 |
| 2017 | $9,493 | $50,172 | $2,869 | $47,303 |
| 2016 | $10,049 | $50,172 | $2,869 | $47,303 |
| 2015 | $8,370 | $50,172 | $2,869 | $47,303 |
| 2014 | $8,693 | $51,254 | $2,305 | $48,949 |
| 2013 | $6,716 | $40,729 | $2,305 | $38,424 |
Source: Public Records
About 1200 Condominiums
Map
Nearby Homes
- 1212 N Lake Shore Dr Unit 16BS
- 1212 N Lake Shore Dr Unit 28CS
- 1212 N Lake Shore Dr Unit 11CS
- 1212 N Lake Shore Dr Unit 34BN
- 1212 N Lake Shore Dr Unit 12CN
- 1150 N Lake Shore Dr Unit 7E
- 1150 N Lake Shore Dr Unit 19A
- 1150 N Lake Shore Dr Unit 9J
- 1150 N Lake Shore Dr Unit 13D
- 1240 N Lake Shore Dr Unit 25A
- 1240 N Lake Shore Dr Unit 14A
- 53 E Division St
- 60 E Scott St Unit 403
- 1242 N Lake Shore Dr Unit 22
- 1242 N Lake Shore Dr Unit 25
- 1242 N Lake Shore Dr Unit 4N
- 1120 N Lake Shore Dr Unit 18CD
- 1110 N Lake Shore Dr Unit 3N
- 1110 N Lake Shore Dr Unit 20S
- 1120 N Lake Shore Dr Unit 12A
- 1200 N Lake Shore Dr Unit 704
- 1200 N Lake Shore Dr Unit 1005
- 1200 N Lake Shore Dr Unit 304
- 1200 N Lake Shore Dr Unit 1004
- 1200 N Lake Shore Dr Unit 1001
- 1200 N Lake Shore Dr Unit 1102
- 1200 N Lake Shore Dr Unit 606
- 1200 N Lake Shore Dr Unit M5
- 1200 N Lake Shore Dr Unit 406
- 1200 N Lake Shore Dr Unit 916
- 1200 N Lake Shore Dr Unit 1204
- 1200 N Lake Shore Dr Unit 1201
- 1200 N Lake Shore Dr Unit 502
- 1200 N Lake Shore Dr Unit 1002
- 1200 N Lake Shore Dr Unit 804
- 1200 N Lake Shore Dr Unit 701
- 1200 N Lake Shore Dr Unit 605
- 1200 N Lake Shore Dr Unit 604
- 1200 N Lake Shore Dr Unit 402
- 1200 N Lake Shore Dr Unit 302