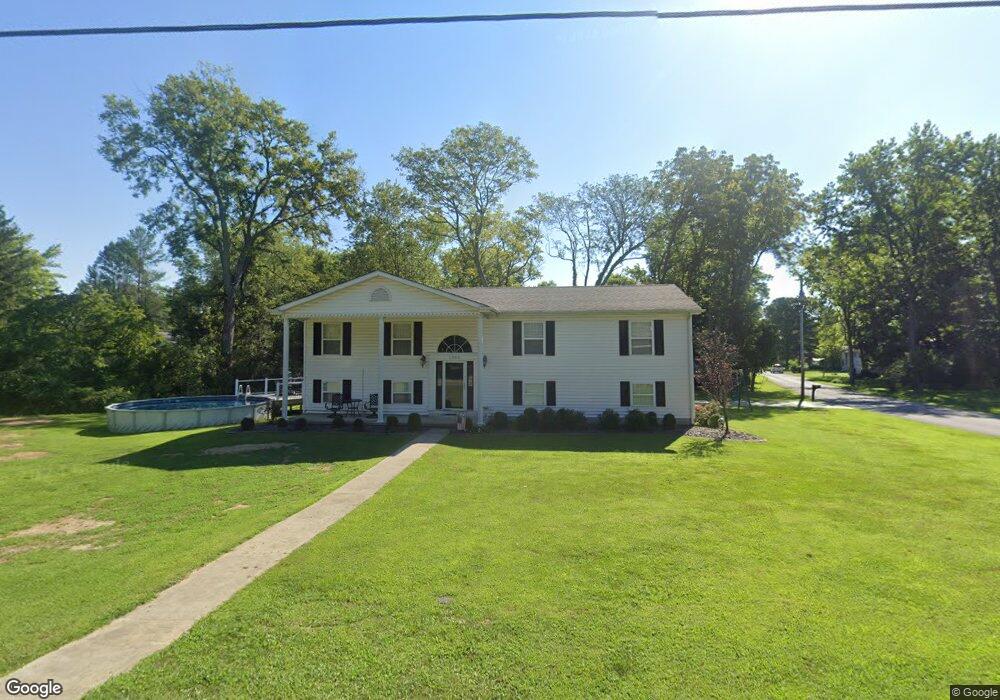
1200 Wilshire Dr Mount Vernon, IL 62864
Estimated Value: $161,000 - $205,520
3
Beds
3
Baths
1,672
Sq Ft
$112/Sq Ft
Est. Value
About This Home
This home is located at 1200 Wilshire Dr, Mount Vernon, IL 62864 and is currently estimated at $187,630, approximately $112 per square foot. 1200 Wilshire Dr is a home located in Jefferson County with nearby schools including Osborne Primary Center, J.L. Buford Intermediate Education Center, and Zadok Casey Middle School.
Ownership History
Date
Name
Owned For
Owner Type
Purchase Details
Closed on
Jun 3, 2013
Sold by
Bledsoe James W and Bledsoe Diana M
Bought by
Reeves Anthony J and Reeves Michelle A
Current Estimated Value
Home Financials for this Owner
Home Financials are based on the most recent Mortgage that was taken out on this home.
Original Mortgage
$107,000
Outstanding Balance
$23,704
Interest Rate
3.25%
Mortgage Type
New Conventional
Estimated Equity
$163,926
Purchase Details
Closed on
Apr 21, 2010
Sold by
Deutsche Bank National Trust Company
Bought by
Hall Jacqueline M and Hall Jody K
Home Financials for this Owner
Home Financials are based on the most recent Mortgage that was taken out on this home.
Original Mortgage
$81,321
Interest Rate
5.3%
Mortgage Type
Purchase Money Mortgage
Purchase Details
Closed on
Aug 3, 2009
Sold by
Rider Penny
Bought by
Deutsche Bank National Trust Company
Create a Home Valuation Report for This Property
The Home Valuation Report is an in-depth analysis detailing your home's value as well as a comparison with similar homes in the area
Home Values in the Area
Average Home Value in this Area
Purchase History
| Date | Buyer | Sale Price | Title Company |
|---|---|---|---|
| Reeves Anthony J | $201,000 | None Available | |
| Hall Jacqueline M | $80,000 | Multiple | |
| Deutsche Bank National Trust Company | -- | None Available |
Source: Public Records
Mortgage History
| Date | Status | Borrower | Loan Amount |
|---|---|---|---|
| Open | Reeves Anthony J | $107,000 | |
| Previous Owner | Hall Jacqueline M | $81,321 |
Source: Public Records
Tax History Compared to Growth
Tax History
| Year | Tax Paid | Tax Assessment Tax Assessment Total Assessment is a certain percentage of the fair market value that is determined by local assessors to be the total taxable value of land and additions on the property. | Land | Improvement |
|---|---|---|---|---|
| 2024 | $4,122 | $53,479 | $8,488 | $44,991 |
| 2023 | $3,782 | $49,371 | $7,836 | $41,535 |
| 2022 | $3,609 | $43,308 | $6,874 | $36,434 |
| 2021 | $3,417 | $41,246 | $6,547 | $34,699 |
| 2020 | $3,415 | $38,548 | $6,119 | $32,429 |
| 2019 | $3,369 | $38,548 | $6,119 | $32,429 |
| 2018 | $3,325 | $38,548 | $6,119 | $32,429 |
| 2017 | $3,252 | $38,548 | $6,119 | $32,429 |
| 2016 | $3,159 | $38,548 | $6,119 | $32,429 |
| 2015 | $3,091 | $38,548 | $6,119 | $32,429 |
| 2014 | $3,836 | $38,548 | $6,119 | $32,429 |
| 2013 | $3,836 | $36,366 | $5,773 | $30,593 |
Source: Public Records
Map
Nearby Homes
- 8 Northbrook Dr
- 1812 Franklin Ave
- 1800 Franklin Ave
- 1909 Olive St
- 19 Wildwood Dr
- 0000 Illinois 15
- Lot 7 E Cedar Hills Estates
- 0000 N 27th St
- 10 Homestead Dr
- 713 N 10th St
- 12152 E Meadows Dr
- 10 Edgewood Rd
- 2 Webster Hill St E
- 6 Brookhaven Dr
- 704 N 8th St
- 419 N Johnson Ave
- 200 N 12th St Unit 206 N
- 704 Royal Ave
- 2004 N Woods Place
- 2006 N Woods Place
- 1112 Wilshire Dr
- 1 Northbrook Dr
- 1208 Wilshire Dr
- 1108 Wilshire Dr
- 1819 Warren Ave
- 2 Northbrook Dr
- 0000 Wilshire Dr
- 1809 Lambert Ave
- 1815 Warren Ave
- 3 Northbrook Dr
- 35 Northbrook Dr
- 1104 Wilshire Dr
- 34 Northbrook Dr
- 1807 Lambert Ave
- 33 Northbrook Dr
- 1813 Warren Ave
- 26 N Highland E
- 26 N Highland E
- 4 Northbrook Dr
- 32 Northbrook Dr