12002 Costa Del Rey Ct Houston, TX 77041
Eldridge North NeighborhoodEstimated Value: $562,000 - $705,000
4
Beds
4
Baths
3,465
Sq Ft
$179/Sq Ft
Est. Value
About This Home
This home is located at 12002 Costa Del Rey Ct, Houston, TX 77041 and is currently estimated at $618,682, approximately $178 per square foot. 12002 Costa Del Rey Ct is a home located in Harris County with nearby schools including Kirk Elementary School, Truitt Middle School, and Cypress Ridge High School.
Ownership History
Date
Name
Owned For
Owner Type
Purchase Details
Closed on
Jan 25, 2016
Sold by
Fleury Arul L and Fleury Jill M
Bought by
Redondo Santiago Victor
Current Estimated Value
Purchase Details
Closed on
Jan 25, 2006
Sold by
Michaels Matthew J and Michaels Tara L
Bought by
Fleury Arul L and Fleury Jill M
Home Financials for this Owner
Home Financials are based on the most recent Mortgage that was taken out on this home.
Original Mortgage
$244,000
Interest Rate
6.22%
Mortgage Type
Fannie Mae Freddie Mac
Purchase Details
Closed on
Nov 16, 2000
Sold by
Houston Village Builders Inc
Bought by
Michaels Matthew J and Michaels Tara L
Home Financials for this Owner
Home Financials are based on the most recent Mortgage that was taken out on this home.
Original Mortgage
$201,750
Interest Rate
7.82%
Create a Home Valuation Report for This Property
The Home Valuation Report is an in-depth analysis detailing your home's value as well as a comparison with similar homes in the area
Home Values in the Area
Average Home Value in this Area
Purchase History
| Date | Buyer | Sale Price | Title Company |
|---|---|---|---|
| Redondo Santiago Victor | -- | Chicago Title | |
| Fleury Arul L | -- | Chicago Title Insurance Comp | |
| Michaels Matthew J | -- | Regency Title Company | |
| Lennar Homes Of Texas Sales & Mktg Ltd | -- | Regency Title Company |
Source: Public Records
Mortgage History
| Date | Status | Borrower | Loan Amount |
|---|---|---|---|
| Previous Owner | Fleury Arul L | $244,000 | |
| Previous Owner | Michaels Matthew J | $201,750 |
Source: Public Records
Tax History Compared to Growth
Tax History
| Year | Tax Paid | Tax Assessment Tax Assessment Total Assessment is a certain percentage of the fair market value that is determined by local assessors to be the total taxable value of land and additions on the property. | Land | Improvement |
|---|---|---|---|---|
| 2025 | $8,491 | $537,103 | $132,425 | $404,678 |
| 2024 | $8,491 | $589,300 | $120,522 | $468,778 |
| 2023 | $8,491 | $488,766 | $120,522 | $368,244 |
| 2022 | $10,348 | $477,000 | $104,651 | $372,349 |
| 2021 | $9,909 | $407,600 | $104,651 | $302,949 |
| 2020 | $9,877 | $396,000 | $87,291 | $308,709 |
| 2019 | $10,456 | $405,968 | $77,133 | $328,835 |
| 2018 | $4,478 | $420,000 | $77,133 | $342,867 |
| 2017 | $10,757 | $420,000 | $77,133 | $342,867 |
| 2016 | $10,757 | $420,000 | $77,133 | $342,867 |
| 2015 | $11,947 | $513,200 | $77,133 | $436,067 |
| 2014 | $11,947 | $455,302 | $70,255 | $385,047 |
Source: Public Records
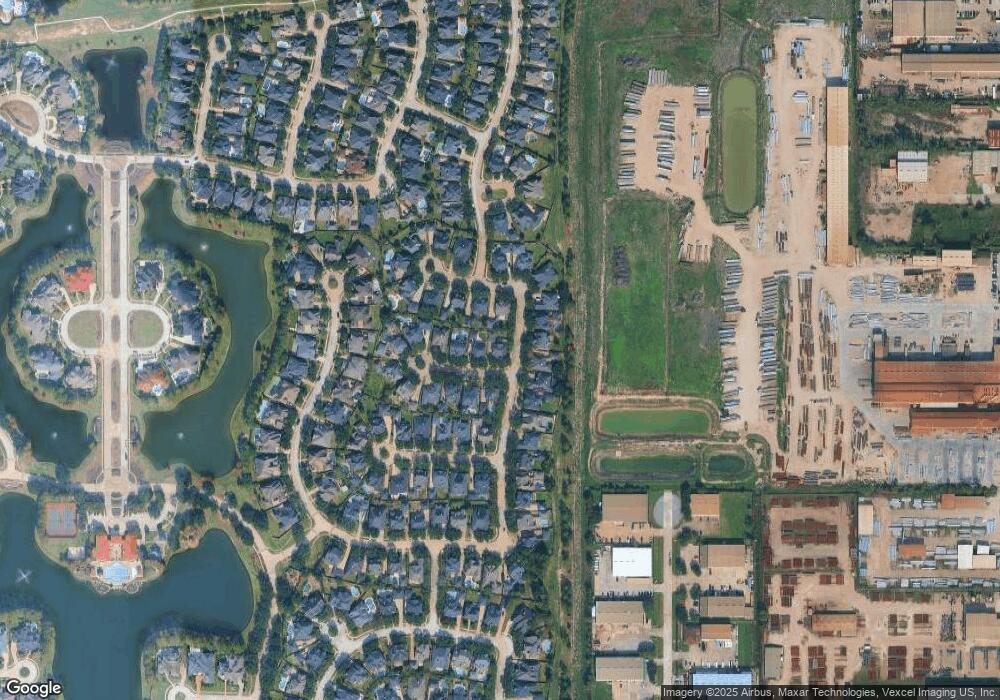
Map
Nearby Homes
- 6214 Laguna Del Rey Dr
- 12023 Bolero Point Ln
- 12042 Bolero Point Ln
- 12110 Arroyo Verde Ln
- 6114 Sonora Canyon Cir
- 6507 Montana Ridge Ct
- 5930 Solar Point Ln
- 6518 Montana Ridge Ct
- 5823 Santa fe Springs Dr
- 6207 Cibola Park Ln
- 12442 Lago Bend Ln
- 6210 Ballina Canyon Ln
- 6114 Sienna Arbor Ln
- 5603 Ballina Canyon Ln
- 5319 Green Cove Bend Ln
- 12511 Clover Walk Ln
- 11118 Cedarview Ln
- 13011 Mossy Ridge Cove
- 12903 Dove Point Ln
- 5803 Song Ridge Ct
- 12006 Costa Del Rey Ct
- 12003 Concho Bay Ct
- 12010 Costa Del Rey Ct
- 12007 Concho Bay Ct
- 6210 Laguna Del Rey Dr
- 12003 Costa Del Rey Ct
- 6218 Laguna Del Rey Dr
- 6206 Laguna Del Rey Dr
- 12007 Costa Del Rey Ct
- 12014 Costa Del Rey Ct
- 12011 Concho Bay Ct
- 6202 Laguna Del Rey Dr
- 6222 Laguna Del Rey Dr
- 12011 Costa Del Rey Ct
- 12015 Concho Bay Ct
- 6130 Laguna Del Rey Dr
- 12015 Costa Del Rey Ct
- 12018 Costa Del Rey Ct
- 12006 Concho Bay Ct
- 12002 Isle Vista Dr