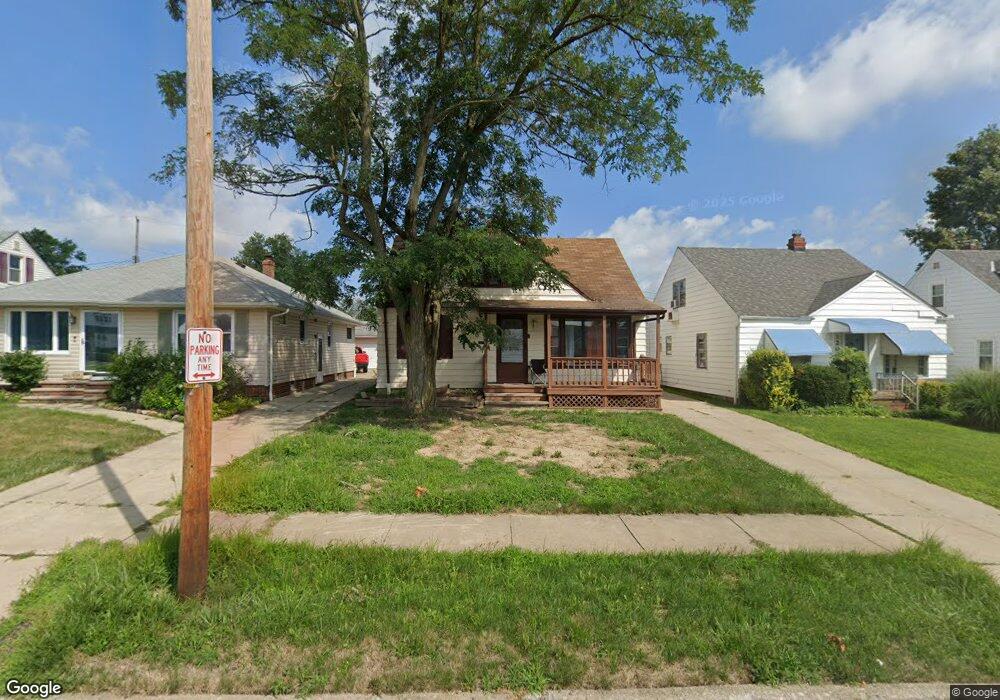
12003 Derby Rd Cleveland, OH 44125
Estimated Value: $129,098 - $147,000
3
Beds
2
Baths
1,164
Sq Ft
$119/Sq Ft
Est. Value
About This Home
This home is located at 12003 Derby Rd, Cleveland, OH 44125 and is currently estimated at $138,275, approximately $118 per square foot. 12003 Derby Rd is a home located in Cuyahoga County with nearby schools including Garfield Heights High School, North Shore High School, and St Benedict Catholic School.
Ownership History
Date
Name
Owned For
Owner Type
Purchase Details
Closed on
Oct 13, 2015
Sold by
Janda Enterprises Inc
Bought by
Janda Kamalsit S
Current Estimated Value
Purchase Details
Closed on
Mar 28, 2013
Sold by
Fannie Mae
Bought by
Janda Enterprises Inc
Purchase Details
Closed on
Dec 19, 2012
Sold by
Poulos Charles and Poulos Beverly
Bought by
Fannie Mae
Purchase Details
Closed on
Feb 13, 1998
Sold by
Leonardi David P
Bought by
Poulos Beverly
Home Financials for this Owner
Home Financials are based on the most recent Mortgage that was taken out on this home.
Original Mortgage
$63,000
Interest Rate
7.23%
Purchase Details
Closed on
Jul 13, 1981
Sold by
Leonardi Elaine M
Bought by
Leonardi David P
Purchase Details
Closed on
Jan 1, 1975
Bought by
Leonardi Elaine M
Create a Home Valuation Report for This Property
The Home Valuation Report is an in-depth analysis detailing your home's value as well as a comparison with similar homes in the area
Home Values in the Area
Average Home Value in this Area
Purchase History
| Date | Buyer | Sale Price | Title Company |
|---|---|---|---|
| Janda Kamalsit S | -- | None Available | |
| Janda Enterprises Inc | $8,000 | Ohio Title Corp | |
| Fannie Mae | $20,000 | Attorney | |
| Poulos Beverly | $88,000 | U S Title Agency Inc | |
| Leonardi David P | $50,000 | -- | |
| Leonardi Elaine M | -- | -- |
Source: Public Records
Mortgage History
| Date | Status | Borrower | Loan Amount |
|---|---|---|---|
| Previous Owner | Poulos Beverly | $63,000 |
Source: Public Records
Tax History Compared to Growth
Tax History
| Year | Tax Paid | Tax Assessment Tax Assessment Total Assessment is a certain percentage of the fair market value that is determined by local assessors to be the total taxable value of land and additions on the property. | Land | Improvement |
|---|---|---|---|---|
| 2024 | $3,983 | $37,975 | $8,050 | $29,925 |
| 2023 | $3,058 | $26,820 | $5,780 | $21,040 |
| 2022 | $3,015 | $26,810 | $5,780 | $21,040 |
| 2021 | $3,188 | $26,810 | $5,780 | $21,040 |
| 2020 | $2,740 | $21,460 | $4,620 | $16,840 |
| 2019 | $4,134 | $61,300 | $13,200 | $48,100 |
| 2018 | $2,706 | $21,460 | $4,620 | $16,840 |
| 2017 | $2,712 | $20,060 | $3,850 | $16,210 |
| 2016 | $2,953 | $20,060 | $3,850 | $16,210 |
| 2015 | $2,644 | $20,060 | $3,850 | $16,210 |
| 2014 | $2,644 | $21,110 | $4,060 | $17,050 |
Source: Public Records
Map
Nearby Homes
- 11808 Fordham Rd
- 12313 Eastwood Blvd
- 5781 Turney Rd
- 12214 Woodward Blvd
- 12512 York Blvd
- 5584 Turney Rd
- 12025 Orme Rd
- 5817 Turney Rd
- 5570 Cumberland Dr
- 12100 Orme Rd
- 12120 Orme Rd
- 12324 Oak Park Blvd
- 12095 Havana Rd
- 12203 Havana Rd
- 5581 Saxon Dr
- 12912 Thraves Rd
- 11813 Willard Ave
- 12804 Havana Rd
- 12813 Oak Park Blvd
- 5552 Briarcliff Dr
- 12003 Derby Ave
- 12007 Derby Ave
- 11909 Derby Ave
- 12011 Derby Ave
- 11905 Derby Ave
- 12015 Derby Ave
- 11816 Hastings Rd
- 11812 Hastings Rd
- 11900 Hastings Rd
- 11901 Derby Ave
- 11912 Derby Ave
- 11908 Derby Ave
- 11718 Hastings Rd
- 11916 Derby Ave
- 11904 Derby Ave
- 11716 Hastings Rd
- 12002 Derby Ave
- 11900 Derby Ave
- 11912 Hastings Rd
- 11815 Derby Ave