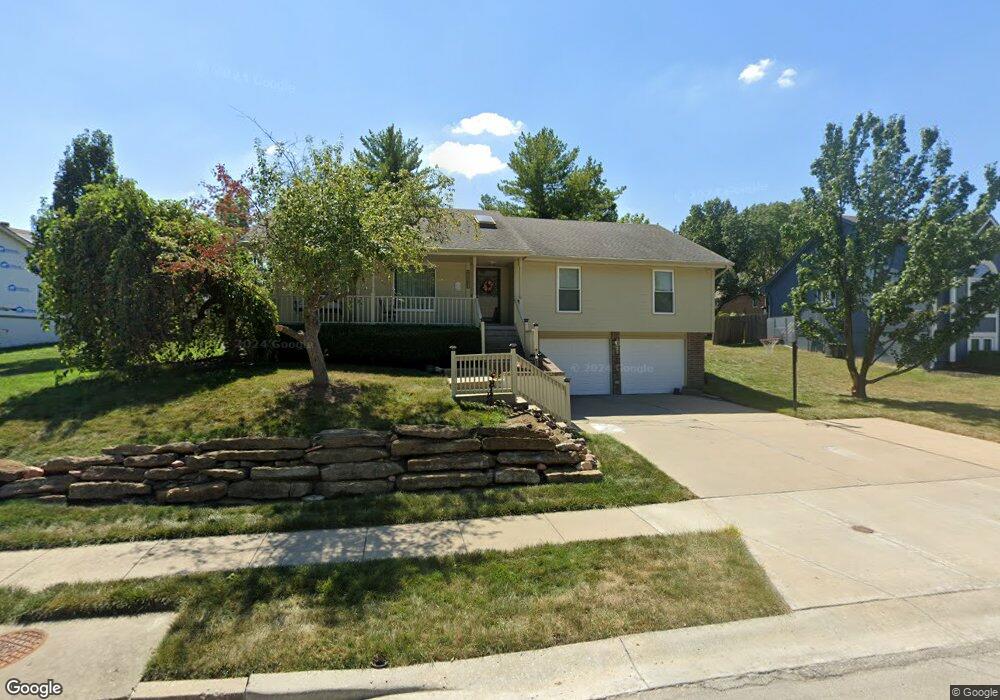
12013 E 78th Terrace Raytown, MO 64138
Little Blue Valley NeighborhoodEstimated Value: $277,526 - $305,000
3
Beds
2
Baths
1,772
Sq Ft
$166/Sq Ft
Est. Value
About This Home
This home is located at 12013 E 78th Terrace, Raytown, MO 64138 and is currently estimated at $294,382, approximately $166 per square foot. 12013 E 78th Terrace is a home located in Jackson County with nearby schools including Robinson Elementary School, Raytown Central Middle School, and Carver Christian Academy.
Ownership History
Date
Name
Owned For
Owner Type
Purchase Details
Closed on
May 2, 2006
Sold by
Seigler Christopher K and Seigler Linda D
Bought by
Momon Allen and Momon Patricia A
Current Estimated Value
Home Financials for this Owner
Home Financials are based on the most recent Mortgage that was taken out on this home.
Original Mortgage
$175,500
Outstanding Balance
$105,770
Interest Rate
7.12%
Mortgage Type
Fannie Mae Freddie Mac
Estimated Equity
$188,612
Purchase Details
Closed on
Sep 9, 2000
Sold by
Sheehy Thene M and Sheehy Roger H
Bought by
Seigler Christopher K and Seigler Linda D
Purchase Details
Closed on
Oct 23, 1996
Sold by
Williams David L
Bought by
Marquardt Thene A
Home Financials for this Owner
Home Financials are based on the most recent Mortgage that was taken out on this home.
Original Mortgage
$115,900
Interest Rate
8.31%
Mortgage Type
Purchase Money Mortgage
Create a Home Valuation Report for This Property
The Home Valuation Report is an in-depth analysis detailing your home's value as well as a comparison with similar homes in the area
Home Values in the Area
Average Home Value in this Area
Purchase History
| Date | Buyer | Sale Price | Title Company |
|---|---|---|---|
| Momon Allen | -- | First American Title Ins Co | |
| Seigler Christopher K | -- | Guaranty Land Title Ins Inc | |
| Marquardt Thene A | -- | -- |
Source: Public Records
Mortgage History
| Date | Status | Borrower | Loan Amount |
|---|---|---|---|
| Open | Momon Allen | $175,500 | |
| Previous Owner | Marquardt Thene A | $115,900 |
Source: Public Records
Tax History Compared to Growth
Tax History
| Year | Tax Paid | Tax Assessment Tax Assessment Total Assessment is a certain percentage of the fair market value that is determined by local assessors to be the total taxable value of land and additions on the property. | Land | Improvement |
|---|---|---|---|---|
| 2025 | $3,031 | $36,250 | $7,336 | $28,914 |
| 2024 | $3,011 | $33,484 | $4,366 | $29,118 |
| 2023 | $3,011 | $33,483 | $4,535 | $28,948 |
| 2022 | $3,360 | $35,910 | $4,087 | $31,823 |
| 2021 | $3,359 | $35,910 | $4,087 | $31,823 |
| 2020 | $3,232 | $34,144 | $4,087 | $30,057 |
| 2019 | $3,171 | $34,144 | $4,087 | $30,057 |
| 2018 | $2,748 | $29,716 | $3,557 | $26,159 |
| 2017 | $2,748 | $29,716 | $3,557 | $26,159 |
| 2016 | $2,513 | $27,359 | $4,893 | $22,466 |
| 2014 | $2,449 | $26,562 | $4,750 | $21,812 |
Source: Public Records
Map
Nearby Homes
- 12000 E 78th Terrace
- 8001 Westridge Rd Unit 203
- 7809 Woodson Rd
- 7539 Westridge Rd
- 7600 Woodson Rd
- 11308 E 78th St
- 11309 E 78th Terrace
- 7950/7951/7902 Frost Rd
- 11601 E 75th St
- 11307 E 77th Terrace
- 11808 E 74th Terrace
- 11211 E 77th St
- 7720 Crisp Ave
- 7411 Englewood Ln
- 10912 E State Route 350
- 7308 Crisp Ave
- 10908 E 81st St
- 7236 Crisp Ave
- 11013 E 74th St
- 7416 Harris Ave
- 12009 E 78th Terrace
- 12101 E 78th Terrace
- 12105 E 78th Terrace
- 12010 E 78th Terrace
- 12014 E 78th Terrace
- 7809 Westridge Rd
- 12001 E 78th Terrace
- 12002 E 78th Terrace
- 12109 E 78 Terrace
- 7815 Westridge Rd
- 12005 E 78th St
- 12104 E 78th Terrace
- 12009 E 78th St
- 12003 E 78th St
- 12003 E 78th St
- 12113 E 78th Terrace
- 12108 E 78th Terrace
- 12101 E 78th St
- 12001 E 78th St
- 12112 E 78th Terrace