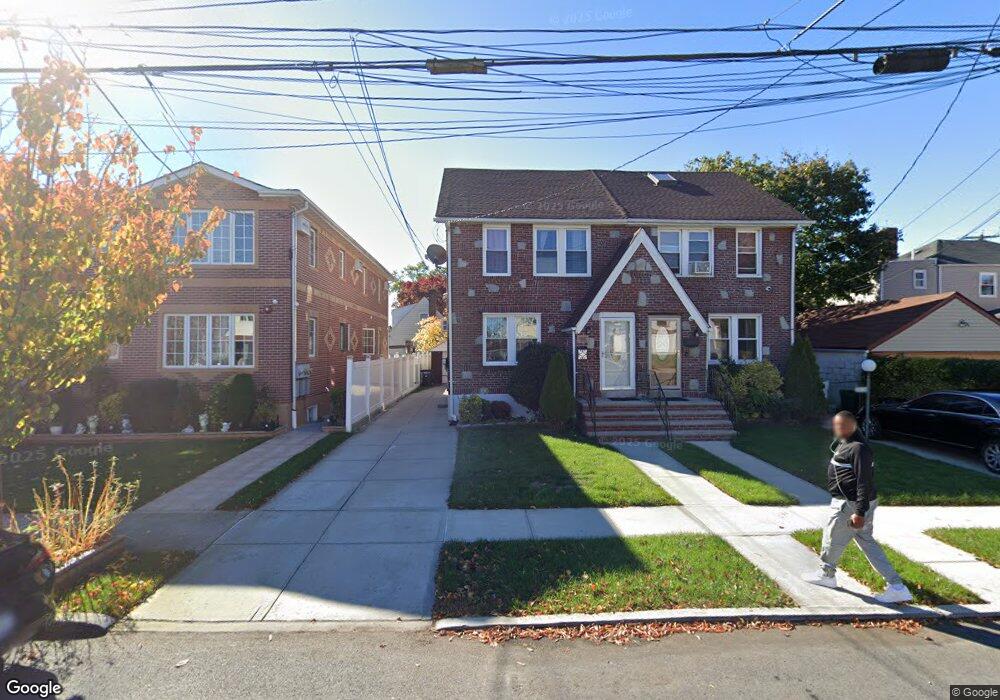
12014 200th St Saint Albans, NY 11412
Saint Albans NeighborhoodEstimated Value: $663,000 - $789,000
--
Bed
--
Bath
1,350
Sq Ft
$530/Sq Ft
Est. Value
About This Home
This home is located at 12014 200th St, Saint Albans, NY 11412 and is currently estimated at $715,878, approximately $530 per square foot. 12014 200th St is a home located in Queens County with nearby schools including P.S. 15 Jackie Robinson, Is 59 Springfield Gardens, and Success Academy Springfield Gardens.
Ownership History
Date
Name
Owned For
Owner Type
Purchase Details
Closed on
Dec 15, 2020
Sold by
Charles Randy I and Peters Keisha
Bought by
Charles Randy I
Current Estimated Value
Home Financials for this Owner
Home Financials are based on the most recent Mortgage that was taken out on this home.
Original Mortgage
$299,000
Outstanding Balance
$265,099
Interest Rate
2.6%
Mortgage Type
Purchase Money Mortgage
Estimated Equity
$450,779
Purchase Details
Closed on
Sep 21, 2011
Sold by
Estate Of Lillian Hinton and Sheila A Hinton-Granito As Executrix
Bought by
Charles Randy I and Peters Keisha
Home Financials for this Owner
Home Financials are based on the most recent Mortgage that was taken out on this home.
Original Mortgage
$293,954
Interest Rate
4.25%
Mortgage Type
Purchase Money Mortgage
Create a Home Valuation Report for This Property
The Home Valuation Report is an in-depth analysis detailing your home's value as well as a comparison with similar homes in the area
Home Values in the Area
Average Home Value in this Area
Purchase History
| Date | Buyer | Sale Price | Title Company |
|---|---|---|---|
| Charles Randy I | -- | -- | |
| Charles Randy I | -- | -- | |
| Charles Randy I | $301,600 | -- | |
| Charles Randy I | $301,600 | -- |
Source: Public Records
Mortgage History
| Date | Status | Borrower | Loan Amount |
|---|---|---|---|
| Open | Charles Randy I | $299,000 | |
| Closed | Charles Randy I | $299,000 | |
| Closed | Charles Randy I | $293,954 |
Source: Public Records
Tax History Compared to Growth
Tax History
| Year | Tax Paid | Tax Assessment Tax Assessment Total Assessment is a certain percentage of the fair market value that is determined by local assessors to be the total taxable value of land and additions on the property. | Land | Improvement |
|---|---|---|---|---|
| 2025 | $5,440 | $28,663 | $8,236 | $20,427 |
| 2024 | $5,440 | $27,086 | $7,664 | $19,422 |
| 2023 | $5,223 | $26,006 | $7,568 | $18,438 |
| 2022 | $5,192 | $35,040 | $12,240 | $22,800 |
| 2021 | $5,328 | $36,540 | $12,240 | $24,300 |
| 2020 | $5,056 | $31,440 | $12,240 | $19,200 |
| 2019 | $4,722 | $29,940 | $12,240 | $17,700 |
| 2018 | $4,418 | $21,672 | $9,846 | $11,826 |
| 2017 | $4,418 | $21,672 | $8,986 | $12,686 |
| 2016 | $4,218 | $21,672 | $8,986 | $12,686 |
| 2015 | $2,466 | $19,905 | $10,435 | $9,470 |
| 2014 | $2,466 | $18,810 | $11,828 | $6,982 |
Source: Public Records
Map
Nearby Homes
- 120-46 199th St
- 120-60 200th St
- 121-16 198th St
- 200-19 119th Ave
- 120-15 196th St
- 12105 196th St
- 118-32 200th St
- 121-17 196th St
- 120-06 Springfield Blvd
- 118-27 201st St
- 118-22 201st
- 121-9 195th St
- 121-11 195th St
- 122-52 Springfield Blvd
- 19415 120th Ave
- 12043 194th St
- 197-20 118th Ave
- 19815 118th Ave
- 118-55 204th St
- 120-20 194th St
- 12012 200th St
- 121-16 200th St
- 12018 200th St Unit 2nd
- 12018 200th St
- 12018 200th St
- 12018 200th St
- 12022 200th St
- 19916 120th Ave
- 120-22 200th St
- 19920 120th Ave
- 12011 199th St
- 12015 199th St
- 12004 200th St
- 199-20 120th Ave
- 12019 199th St
- 19912 120th Ave
- 12026 200th St
- 200-02 120th Ave Unit 2
- 200-02 120th Ave
- 12023 199th St