1203 23rd St Rockford, IL 61108
Keith Creek NeighborhoodEstimated Value: $101,000 - $135,000
2
Beds
1
Bath
1,116
Sq Ft
$108/Sq Ft
Est. Value
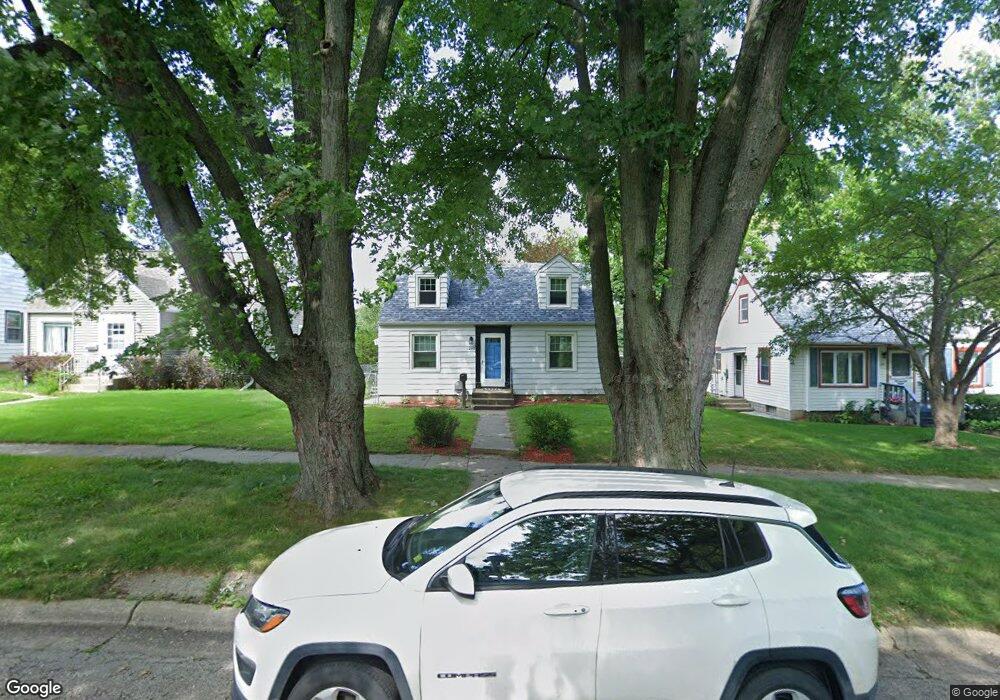
About This Home
This home is located at 1203 23rd St, Rockford, IL 61108 and is currently estimated at $120,273, approximately $107 per square foot. 1203 23rd St is a home located in Winnebago County with nearby schools including Rolling Green Elementary School, Rockford East High School, and Jackson Charter School.
Ownership History
Date
Name
Owned For
Owner Type
Purchase Details
Closed on
May 16, 2022
Sold by
Your Property Solutions-Realington Enter
Bought by
Hoskin Glenn
Current Estimated Value
Home Financials for this Owner
Home Financials are based on the most recent Mortgage that was taken out on this home.
Original Mortgage
$80,750
Outstanding Balance
$77,125
Interest Rate
5.88%
Mortgage Type
New Conventional
Estimated Equity
$43,148
Purchase Details
Closed on
Apr 5, 2022
Sold by
Albright Dale E and Albright Betsy J
Bought by
Your Property Solutions Realington Enterprise
Home Financials for this Owner
Home Financials are based on the most recent Mortgage that was taken out on this home.
Original Mortgage
$80,750
Outstanding Balance
$77,125
Interest Rate
5.88%
Mortgage Type
New Conventional
Estimated Equity
$43,148
Purchase Details
Closed on
Apr 30, 2007
Bought by
Albright Dale E and Albright Betsy J
Create a Home Valuation Report for This Property
The Home Valuation Report is an in-depth analysis detailing your home's value as well as a comparison with similar homes in the area
Home Values in the Area
Average Home Value in this Area
Purchase History
| Date | Buyer | Sale Price | Title Company |
|---|---|---|---|
| Hoskin Glenn | $85,000 | Schlueter Ecklund & Davitt/Jh | |
| Your Property Solutions Realington Enterprise | $59,000 | Reese & Reese | |
| Albright Dale E | $78,000 | -- |
Source: Public Records
Mortgage History
| Date | Status | Borrower | Loan Amount |
|---|---|---|---|
| Open | Hoskin Glenn | $80,750 |
Source: Public Records
Tax History Compared to Growth
Tax History
| Year | Tax Paid | Tax Assessment Tax Assessment Total Assessment is a certain percentage of the fair market value that is determined by local assessors to be the total taxable value of land and additions on the property. | Land | Improvement |
|---|---|---|---|---|
| 2024 | $1,971 | $26,800 | $5,488 | $21,312 |
| 2023 | $1,831 | $23,631 | $4,839 | $18,792 |
| 2022 | $2,413 | $21,122 | $4,325 | $16,797 |
| 2021 | $1,638 | $19,368 | $3,966 | $15,402 |
| 2020 | $1,583 | $18,309 | $3,749 | $14,560 |
| 2019 | $1,534 | $17,450 | $3,573 | $13,877 |
| 2018 | $1,600 | $16,349 | $3,367 | $12,982 |
| 2017 | $1,605 | $15,646 | $3,222 | $12,424 |
| 2016 | $1,634 | $15,353 | $3,162 | $12,191 |
| 2015 | $1,655 | $15,353 | $3,162 | $12,191 |
| 2014 | $2,220 | $17,088 | $3,948 | $13,140 |
Source: Public Records
Map
Nearby Homes