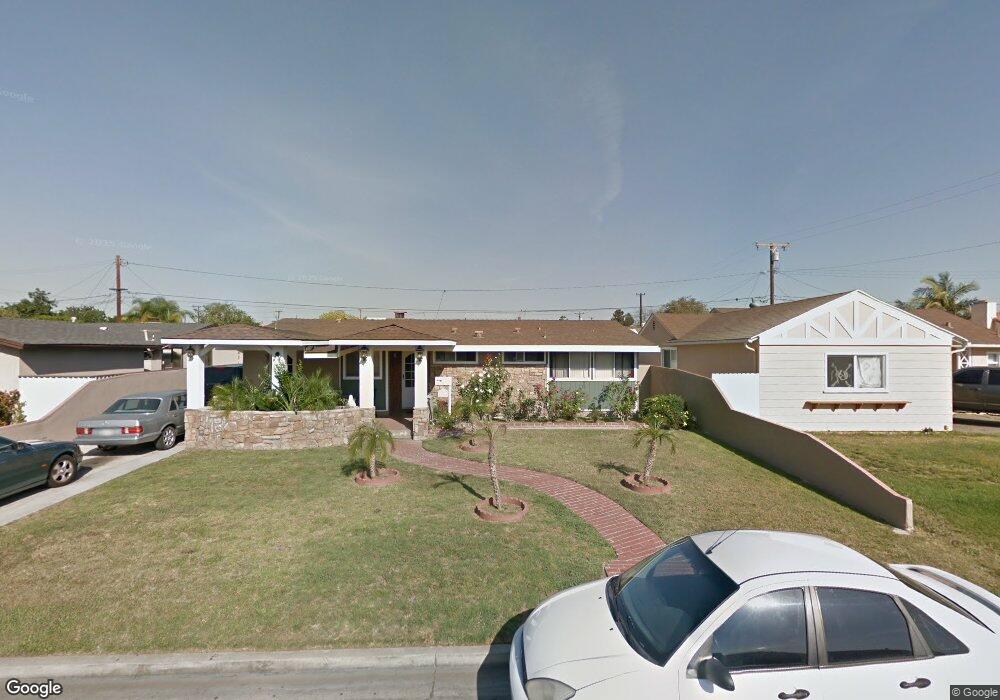
12032 Kathy Ln Garden Grove, CA 92840
Estimated Value: $901,516 - $1,038,000
3
Beds
2
Baths
1,210
Sq Ft
$806/Sq Ft
Est. Value
About This Home
This home is located at 12032 Kathy Ln, Garden Grove, CA 92840 and is currently estimated at $975,129, approximately $805 per square foot. 12032 Kathy Ln is a home located in Orange County with nearby schools including Crosby Elementary School, Izaak Walton Intermediate School, and Garden Grove High School.
Ownership History
Date
Name
Owned For
Owner Type
Purchase Details
Closed on
Aug 2, 2004
Sold by
Ramos Margarita Sanchez and Diaz Ignacio Vega
Bought by
Perez Javier and Perez Carmen
Current Estimated Value
Home Financials for this Owner
Home Financials are based on the most recent Mortgage that was taken out on this home.
Original Mortgage
$136,100
Interest Rate
5.95%
Mortgage Type
New Conventional
Purchase Details
Closed on
Sep 12, 1996
Sold by
Bank United Of Texas Fsb
Bought by
Perez Javier and Perez Carmen
Home Financials for this Owner
Home Financials are based on the most recent Mortgage that was taken out on this home.
Original Mortgage
$143,388
Interest Rate
8.37%
Mortgage Type
FHA
Purchase Details
Closed on
May 23, 1996
Sold by
Rodriguez Tom H and Rodriguez Mary Jane
Bought by
Bank United Of Texas Fsb
Create a Home Valuation Report for This Property
The Home Valuation Report is an in-depth analysis detailing your home's value as well as a comparison with similar homes in the area
Home Values in the Area
Average Home Value in this Area
Purchase History
| Date | Buyer | Sale Price | Title Company |
|---|---|---|---|
| Perez Javier | -- | Landsafe Title | |
| Perez Javier | $145,500 | Gateway Title | |
| Bank United Of Texas Fsb | $113,800 | Benefit Land Title Ins Co |
Source: Public Records
Mortgage History
| Date | Status | Borrower | Loan Amount |
|---|---|---|---|
| Closed | Perez Javier | $136,100 | |
| Previous Owner | Perez Javier | $143,388 |
Source: Public Records
Tax History Compared to Growth
Tax History
| Year | Tax Paid | Tax Assessment Tax Assessment Total Assessment is a certain percentage of the fair market value that is determined by local assessors to be the total taxable value of land and additions on the property. | Land | Improvement |
|---|---|---|---|---|
| 2025 | $3,196 | $243,179 | $159,849 | $83,330 |
| 2024 | $3,196 | $238,411 | $156,714 | $81,697 |
| 2023 | $3,133 | $233,737 | $153,641 | $80,096 |
| 2022 | $3,062 | $229,154 | $150,628 | $78,526 |
| 2021 | $3,018 | $224,661 | $147,674 | $76,987 |
| 2020 | $2,982 | $222,358 | $146,160 | $76,198 |
| 2019 | $2,943 | $217,999 | $143,295 | $74,704 |
| 2018 | $2,872 | $213,725 | $140,485 | $73,240 |
| 2017 | $2,841 | $209,535 | $137,731 | $71,804 |
| 2016 | $2,705 | $205,427 | $135,030 | $70,397 |
| 2015 | $2,669 | $202,342 | $133,002 | $69,340 |
| 2014 | $2,606 | $198,379 | $130,397 | $67,982 |
Source: Public Records
Map
Nearby Homes
- 11731 Rose Dr
- 405 13181 Lampson
- 11841 Shetland Rd
- 12246 Nadine Cir
- 11531 Kathy Ln
- 11531 West St
- 11552 9th St
- 12662 Woodland Ln
- 11401 Kathy Ln
- 11402 Morgan Ln
- 11252 Chapman Ave
- 827 W Orangewood Ave
- 12222 Emrys Ave
- 12727 West St
- 2227 S Atlanta St
- 11341 Jacalene Ln
- 12081 Bangor St
- 12688 Chapman Ave Unit 3403
- 12664 Chapman Ave Unit 1208
- 12668 Chapman Ave Unit 2313
- 12012 Kathy Ln
- 12042 Kathy Ln
- 12031 Morgan Ln
- 12052 Kathy Ln
- 12002 Kathy Ln
- 12011 Morgan Ln
- 12041 Morgan Ln
- 12031 Kathy Ln
- 12051 Morgan Ln
- 12001 Morgan Ln
- 12041 Kathy Ln
- 12011 Kathy Ln
- 12062 Kathy Ln
- 12051 Kathy Ln
- 12001 Kathy Ln
- 12061 Morgan Ln
- 12082 Kathy Ln
- 12061 Kathy Ln
- 12022 Robert Ln
- 12081 Morgan Ln