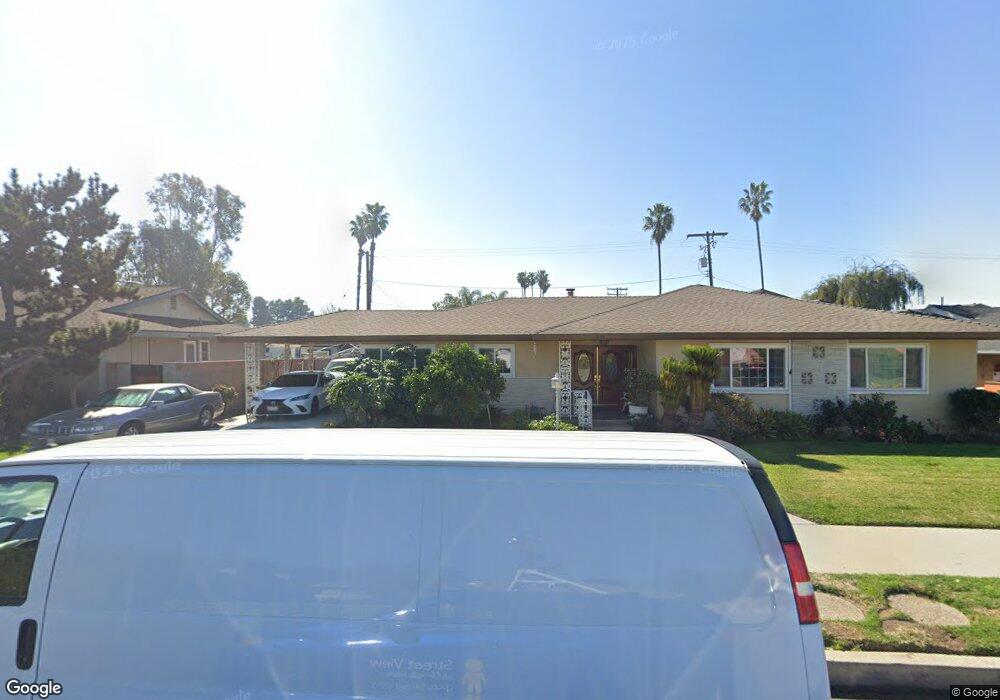
1204 W Westmont Dr Anaheim, CA 92801
Northwest Anaheim NeighborhoodEstimated Value: $1,158,000 - $1,217,000
3
Beds
2
Baths
2,178
Sq Ft
$544/Sq Ft
Est. Value
About This Home
This home is located at 1204 W Westmont Dr, Anaheim, CA 92801 and is currently estimated at $1,183,897, approximately $543 per square foot. 1204 W Westmont Dr is a home located in Orange County with nearby schools including Westmont Elementary School, Sycamore Junior High School, and Anaheim High School.
Ownership History
Date
Name
Owned For
Owner Type
Purchase Details
Closed on
Jul 17, 2018
Sold by
Fuhrman Robert H and Fuhrman Candice Choi
Bought by
Fuhrman Robert H and Fuhrman Candice C
Current Estimated Value
Purchase Details
Closed on
May 5, 2014
Sold by
Fuhrman Robert H
Bought by
Fuhrman Robert H and Fuhrman Candice Choi
Purchase Details
Closed on
Apr 28, 2003
Sold by
Choi Min Ja
Bought by
Fuhrman Robert H
Home Financials for this Owner
Home Financials are based on the most recent Mortgage that was taken out on this home.
Original Mortgage
$311,500
Outstanding Balance
$133,524
Interest Rate
5.72%
Estimated Equity
$1,050,373
Purchase Details
Closed on
Apr 25, 2003
Sold by
Gunnett Janet
Bought by
Fuhrman Robert H
Home Financials for this Owner
Home Financials are based on the most recent Mortgage that was taken out on this home.
Original Mortgage
$311,500
Outstanding Balance
$133,524
Interest Rate
5.72%
Estimated Equity
$1,050,373
Create a Home Valuation Report for This Property
The Home Valuation Report is an in-depth analysis detailing your home's value as well as a comparison with similar homes in the area
Home Values in the Area
Average Home Value in this Area
Purchase History
| Date | Buyer | Sale Price | Title Company |
|---|---|---|---|
| Fuhrman Robert H | -- | None Available | |
| Fuhrman Robert H | -- | None Available | |
| Fuhrman Robert H | -- | North American Title Co | |
| Fuhrman Robert H | $415,000 | North American Title Co |
Source: Public Records
Mortgage History
| Date | Status | Borrower | Loan Amount |
|---|---|---|---|
| Open | Fuhrman Robert H | $311,500 |
Source: Public Records
Tax History Compared to Growth
Tax History
| Year | Tax Paid | Tax Assessment Tax Assessment Total Assessment is a certain percentage of the fair market value that is determined by local assessors to be the total taxable value of land and additions on the property. | Land | Improvement |
|---|---|---|---|---|
| 2025 | $6,867 | $601,048 | $393,541 | $207,507 |
| 2024 | $6,867 | $589,263 | $385,824 | $203,439 |
| 2023 | $6,724 | $577,709 | $378,259 | $199,450 |
| 2022 | $6,642 | $566,382 | $370,842 | $195,540 |
| 2021 | $6,655 | $555,277 | $363,571 | $191,706 |
| 2020 | $6,629 | $549,584 | $359,843 | $189,741 |
| 2019 | $6,428 | $538,808 | $352,787 | $186,021 |
| 2018 | $6,295 | $528,244 | $345,870 | $182,374 |
| 2017 | $6,044 | $517,887 | $339,088 | $178,799 |
| 2016 | $6,029 | $507,733 | $332,439 | $175,294 |
| 2015 | $5,977 | $500,107 | $327,446 | $172,661 |
| 2014 | $5,604 | $490,311 | $321,032 | $169,279 |
Source: Public Records
Map
Nearby Homes
- 609 N Dwyer Dr
- 1417 W James Way
- 1235 W Pearl St
- 700 N Westwood Place
- 917 W Alberta St
- 278 N Wilshire Ave Unit 156
- 849 N Lenz Dr
- 1649 W Lincoln Ave Unit 101
- 945 N Summer St
- 208 S Illinois St
- 625 W La Verne St
- 1136 W Broadway
- 1651 W Lincoln Ave Unit 105
- 1125 N Mayfair Ave
- 1501 W Alexis Ave
- 435 W Center Street Promenade Unit 331
- 435 W Center Street Promenade Unit 401
- 435 W Center Street Promenade Unit 400
- 532 N Manor St
- 1173 N Mayfair Ave
- 1212 W Westmont Dr
- 1200 W Westmont Dr
- 1205 W Connecticut Ave
- 1209 W Connecticut Ave
- 1201 W Connecticut Ave
- 1218 W Westmont Dr
- 1203 W Westmont Dr
- 600 N Tudor Place
- 1217 W Connecticut Ave
- 607 N Carleton Ave
- 590 N Dwyer Dr
- 1226 W Westmont Dr
- 1225 W Connecticut Ave
- 1204 W Connecticut Ave
- 606 N Carleton Ave
- 615 N Carleton Ave
- 580 N Dwyer Dr
- 1218 W Rowan St
- 1200 W Connecticut Ave
- 1218 N Rowan St