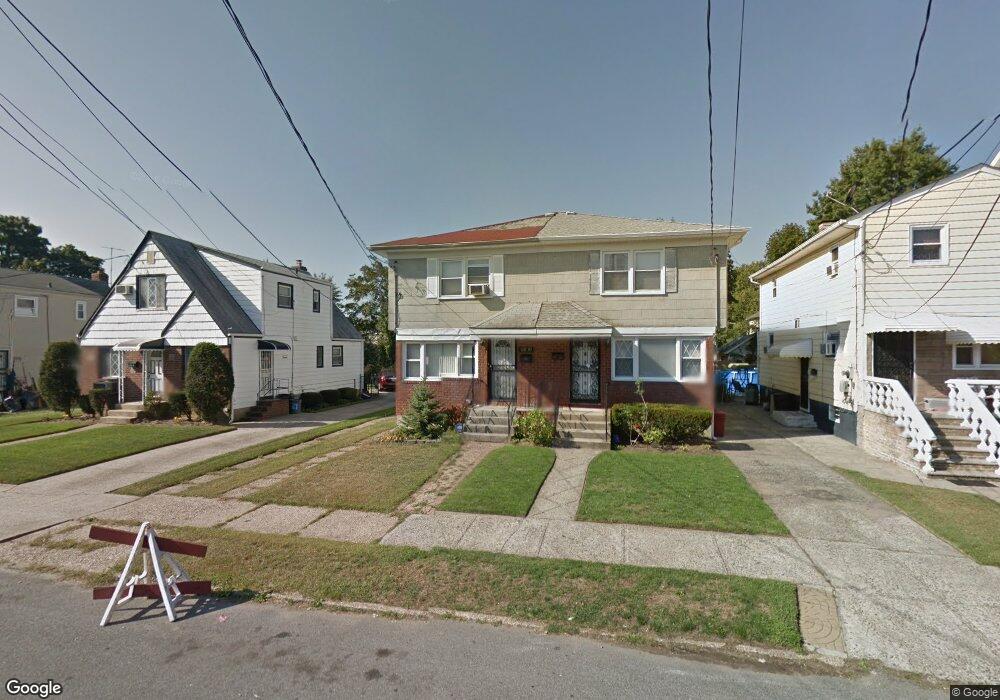
12040 196th St St. Albans, NY 11412
Saint Albans NeighborhoodEstimated Value: $620,000 - $777,000
3
Beds
3
Baths
1,292
Sq Ft
$553/Sq Ft
Est. Value
About This Home
This home is located at 12040 196th St, St. Albans, NY 11412 and is currently estimated at $714,047, approximately $552 per square foot. 12040 196th St is a home located in Queens County with nearby schools including P.S. 15 Jackie Robinson, Is 59 Springfield Gardens, and Success Academy Springfield Gardens.
Ownership History
Date
Name
Owned For
Owner Type
Purchase Details
Closed on
Jun 13, 2017
Sold by
Elmont Street Inc
Bought by
Lindo Andrew
Current Estimated Value
Home Financials for this Owner
Home Financials are based on the most recent Mortgage that was taken out on this home.
Original Mortgage
$441,849
Outstanding Balance
$367,828
Interest Rate
4.05%
Mortgage Type
New Conventional
Estimated Equity
$346,219
Purchase Details
Closed on
Nov 21, 2016
Sold by
U S Bank National Association
Bought by
Elmont Street Inc
Home Financials for this Owner
Home Financials are based on the most recent Mortgage that was taken out on this home.
Original Mortgage
$265,351
Interest Rate
4.16%
Mortgage Type
New Conventional
Purchase Details
Closed on
Dec 15, 2014
Sold by
Risi Esq Referee Joseph J
Bought by
U S Bank National Association As Succe
Purchase Details
Closed on
Jun 17, 2002
Sold by
Mahood Beryl
Bought by
Mahood Beryl and Singho Rodney
Create a Home Valuation Report for This Property
The Home Valuation Report is an in-depth analysis detailing your home's value as well as a comparison with similar homes in the area
Home Values in the Area
Average Home Value in this Area
Purchase History
| Date | Buyer | Sale Price | Title Company |
|---|---|---|---|
| Lindo Andrew | $450,000 | -- | |
| Elmont Street Inc | $275,134 | -- | |
| U S Bank National Association As Succe | $469,868 | -- | |
| Mahood Beryl | -- | -- |
Source: Public Records
Mortgage History
| Date | Status | Borrower | Loan Amount |
|---|---|---|---|
| Open | Lindo Andrew | $441,849 | |
| Previous Owner | Elmont Street Inc | $265,351 |
Source: Public Records
Tax History Compared to Growth
Tax History
| Year | Tax Paid | Tax Assessment Tax Assessment Total Assessment is a certain percentage of the fair market value that is determined by local assessors to be the total taxable value of land and additions on the property. | Land | Improvement |
|---|---|---|---|---|
| 2025 | $5,509 | $29,072 | $8,335 | $20,737 |
| 2024 | $5,509 | $27,427 | $9,428 | $17,999 |
| 2023 | $5,198 | $25,878 | $8,013 | $17,865 |
| 2022 | $5,166 | $35,820 | $12,540 | $23,280 |
| 2021 | $5,404 | $34,680 | $12,540 | $22,140 |
| 2020 | $5,128 | $29,820 | $12,540 | $17,280 |
| 2019 | $4,781 | $31,740 | $12,540 | $19,200 |
| 2018 | $4,396 | $21,565 | $9,489 | $12,076 |
| 2017 | $3,318 | $21,565 | $10,151 | $11,414 |
| 2016 | $4,278 | $21,565 | $10,151 | $11,414 |
| 2015 | $788 | $20,189 | $11,047 | $9,142 |
| 2014 | $788 | $19,047 | $11,131 | $7,916 |
Source: Public Records
Map
Nearby Homes
- 12105 196th St
- 121-17 196th St
- 121-9 195th St
- 121-11 195th St
- 121-16 198th St
- 120-15 196th St
- 12043 194th St
- 194-09 122nd Ave
- 120-46 199th St
- 12054 194th St
- 120-20 194th St
- 19415 120th Ave
- 19401 Nashville Blvd
- 194-01 Nashville Blvd
- 120-60 200th St
- 122-52 Springfield Blvd
- 13024 Springfield Blvd
- 19332 Williamson Ave
- 120-44 192nd St
- 192-17 Williamson Ave
- 12040 196th St
- 12040 196th St
- 12038 196th St
- 12038 196th St
- 12034 196th St
- 12044 196th St
- 120-44 196th St
- 120-44 196th St Unit 2
- 12030 196th St
- 12050 196th St
- 12026 196th St Unit 2nd Fl
- 12026 196th St Unit 2nd Fl
- 12035 195th St
- 12026 196th St
- 12033 195th St
- 120-33 195th St Unit 1st Fl
- 120-33 195th St
- 12043 195th St
- 12031 195th St
- 12052 196th St