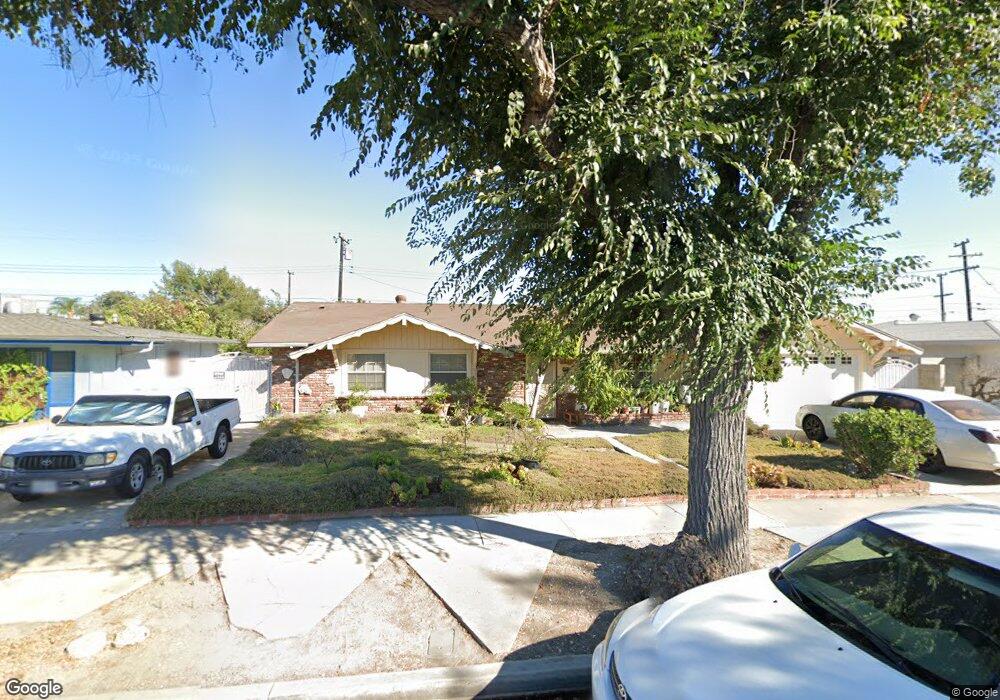
1205 N Hastings St Santa Ana, CA 92703
Riverview West NeighborhoodEstimated Value: $901,575 - $995,000
4
Beds
2
Baths
1,341
Sq Ft
$711/Sq Ft
Est. Value
About This Home
This home is located at 1205 N Hastings St, Santa Ana, CA 92703 and is currently estimated at $953,394, approximately $710 per square foot. 1205 N Hastings St is a home located in Orange County with nearby schools including R. F. Hazard Elementary School, James Irvine Intermediate School, and Santiago High School.
Ownership History
Date
Name
Owned For
Owner Type
Purchase Details
Closed on
Aug 20, 2017
Sold by
Le Nhan Phuoc and Le Thai Nguyen
Bought by
Le Catherine and Le Peter Nguyen
Current Estimated Value
Purchase Details
Closed on
Mar 21, 1995
Sold by
Vanvannguyen Ba Van and Nguyen Binh Thanh
Bought by
Le Nhan Phuoc and Le Thai Nguyen
Home Financials for this Owner
Home Financials are based on the most recent Mortgage that was taken out on this home.
Original Mortgage
$135,000
Interest Rate
8.86%
Mortgage Type
Seller Take Back
Purchase Details
Closed on
Feb 16, 1995
Sold by
Le Nhan Phuoc and Le Thai Nguyen
Bought by
Vanvannguyen Ba Van and Nguyen Binh Thanh
Home Financials for this Owner
Home Financials are based on the most recent Mortgage that was taken out on this home.
Original Mortgage
$135,000
Interest Rate
8.86%
Mortgage Type
Seller Take Back
Create a Home Valuation Report for This Property
The Home Valuation Report is an in-depth analysis detailing your home's value as well as a comparison with similar homes in the area
Home Values in the Area
Average Home Value in this Area
Purchase History
| Date | Buyer | Sale Price | Title Company |
|---|---|---|---|
| Le Catherine | -- | None Available | |
| Le Nhan Phuoc | $135,000 | California Counties Title Co | |
| Vanvannguyen Ba Van | -- | -- |
Source: Public Records
Mortgage History
| Date | Status | Borrower | Loan Amount |
|---|---|---|---|
| Closed | Le Nhan Phuoc | $135,000 |
Source: Public Records
Tax History Compared to Growth
Tax History
| Year | Tax Paid | Tax Assessment Tax Assessment Total Assessment is a certain percentage of the fair market value that is determined by local assessors to be the total taxable value of land and additions on the property. | Land | Improvement |
|---|---|---|---|---|
| 2025 | $2,865 | $226,740 | $152,662 | $74,078 |
| 2024 | $2,865 | $222,295 | $149,669 | $72,626 |
| 2023 | $2,809 | $217,937 | $146,735 | $71,202 |
| 2022 | $2,745 | $213,664 | $143,858 | $69,806 |
| 2021 | $2,708 | $209,475 | $141,037 | $68,438 |
| 2020 | $2,675 | $207,328 | $139,591 | $67,737 |
| 2019 | $2,642 | $203,263 | $136,854 | $66,409 |
| 2018 | $2,579 | $199,278 | $134,171 | $65,107 |
| 2017 | $2,474 | $195,371 | $131,540 | $63,831 |
| 2016 | $2,369 | $191,541 | $128,961 | $62,580 |
| 2015 | $2,337 | $188,664 | $127,024 | $61,640 |
| 2014 | $2,281 | $184,969 | $124,536 | $60,433 |
Source: Public Records
Map
Nearby Homes
- 1114 N Gates St
- 526 W Tribella Ct
- 4201 W 5th St Unit 314
- 1609 N Parsons Place
- 3625 W 11th St
- 3929 W 5th St Unit 16
- 4248 W 5th St
- 1314 N Bewley St
- 3932 W 5th St Unit 202
- 11321 Parkgreen Ln Unit 102
- 702 N Gunther St
- 14376 Euclid St Unit 1-4
- 13322 Euclid St
- 230 Green Dr
- 3424 W Washington Ave Unit 228
- 3424 W Washington Ave Unit 309
- 4832 W 5th St Unit B
- 4518 W 1st St
- 408 N Jackson St
- 501 N Willow Dr
- 1209 N Hastings St
- 1201 N Hastings St
- 1213 N Hastings St
- 1202 N Hastings St
- 1110 N Gates St
- 1106 N Gates St
- 1206 N Hastings St
- 1102 N Gates St
- 1217 N Hastings St
- 1210 N Hastings St
- 4240 Fay Cir
- 1205 N Mountain View St
- 1214 N Hastings St
- 1201 N Mountain View St
- 1209 N Mountain View St
- 1018 N Gates St
- 1213 N Mountain View St
- 1206 N Gates St
- 1221 N Hastings St
- 4314 Oakfield Ave