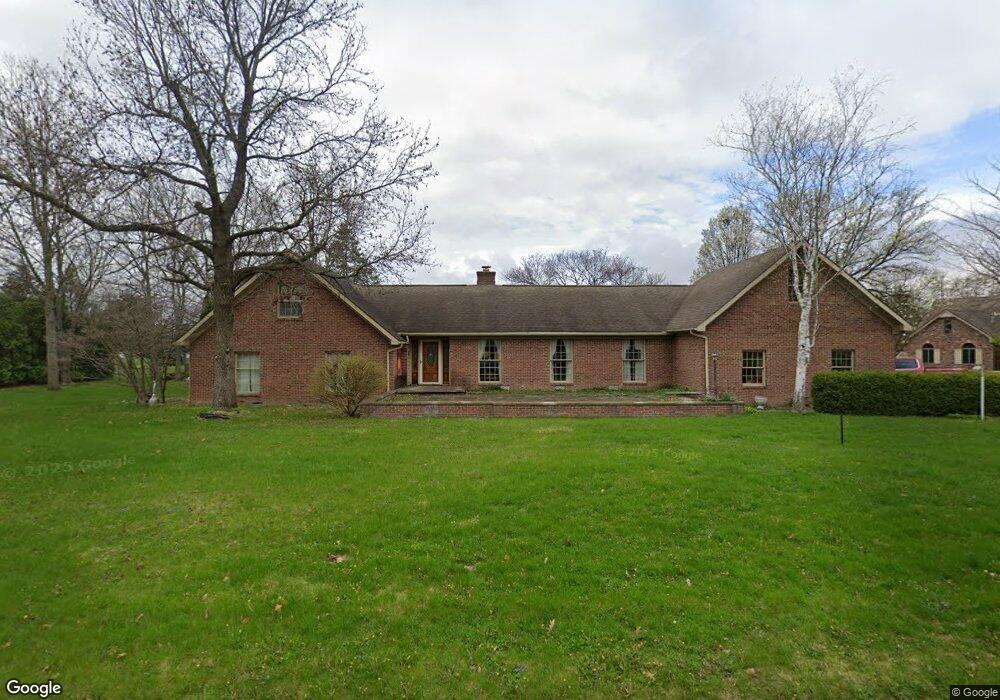
1206 N Oak St Elwood, IN 46036
Estimated Value: $251,000 - $416,000
5
Beds
4
Baths
3,038
Sq Ft
$98/Sq Ft
Est. Value
About This Home
This home is located at 1206 N Oak St, Elwood, IN 46036 and is currently estimated at $298,301, approximately $98 per square foot. 1206 N Oak St is a home located in Madison County with nearby schools including Elwood Elementary School, Elwood Intermediate School, and Elwood Junior-Senior High School.
Ownership History
Date
Name
Owned For
Owner Type
Purchase Details
Closed on
Jun 9, 2009
Sold by
Us Bank National Assn
Bought by
Helping Lucinda A Pierce
Current Estimated Value
Purchase Details
Closed on
Dec 18, 2008
Sold by
Nance Vorpe Amber L
Bought by
Vorpe John L
Purchase Details
Closed on
Nov 19, 2008
Sold by
Vorpe Jon L
Bought by
Moores Merrill
Purchase Details
Closed on
Sep 30, 2005
Sold by
Pantos Thomas D and Pantos Mary M
Bought by
Vorpe Jon L and Vorpe Amber L Nance
Home Financials for this Owner
Home Financials are based on the most recent Mortgage that was taken out on this home.
Original Mortgage
$191,920
Interest Rate
5.65%
Mortgage Type
Adjustable Rate Mortgage/ARM
Create a Home Valuation Report for This Property
The Home Valuation Report is an in-depth analysis detailing your home's value as well as a comparison with similar homes in the area
Home Values in the Area
Average Home Value in this Area
Purchase History
| Date | Buyer | Sale Price | Title Company |
|---|---|---|---|
| Helping Lucinda A Pierce | -- | -- | |
| Vorpe John L | -- | -- | |
| Moores Merrill | -- | -- | |
| Vorpe Jon L | -- | -- |
Source: Public Records
Mortgage History
| Date | Status | Borrower | Loan Amount |
|---|---|---|---|
| Previous Owner | Vorpe Jon L | $191,920 |
Source: Public Records
Tax History Compared to Growth
Tax History
| Year | Tax Paid | Tax Assessment Tax Assessment Total Assessment is a certain percentage of the fair market value that is determined by local assessors to be the total taxable value of land and additions on the property. | Land | Improvement |
|---|---|---|---|---|
| 2024 | $1,892 | $189,200 | $12,100 | $177,100 |
| 2023 | $1,775 | $176,900 | $11,600 | $165,300 |
| 2022 | $1,780 | $176,400 | $11,100 | $165,300 |
| 2021 | $1,640 | $163,400 | $11,100 | $152,300 |
| 2020 | $1,577 | $156,100 | $10,600 | $145,500 |
| 2019 | $1,534 | $151,800 | $10,600 | $141,200 |
| 2018 | $1,471 | $145,500 | $10,600 | $134,900 |
| 2017 | $1,482 | $147,600 | $10,600 | $137,000 |
| 2016 | $1,434 | $142,200 | $10,600 | $131,600 |
| 2014 | $1,441 | $143,900 | $10,600 | $133,300 |
| 2013 | $1,441 | $145,400 | $10,600 | $134,800 |
Source: Public Records
Map
Nearby Homes