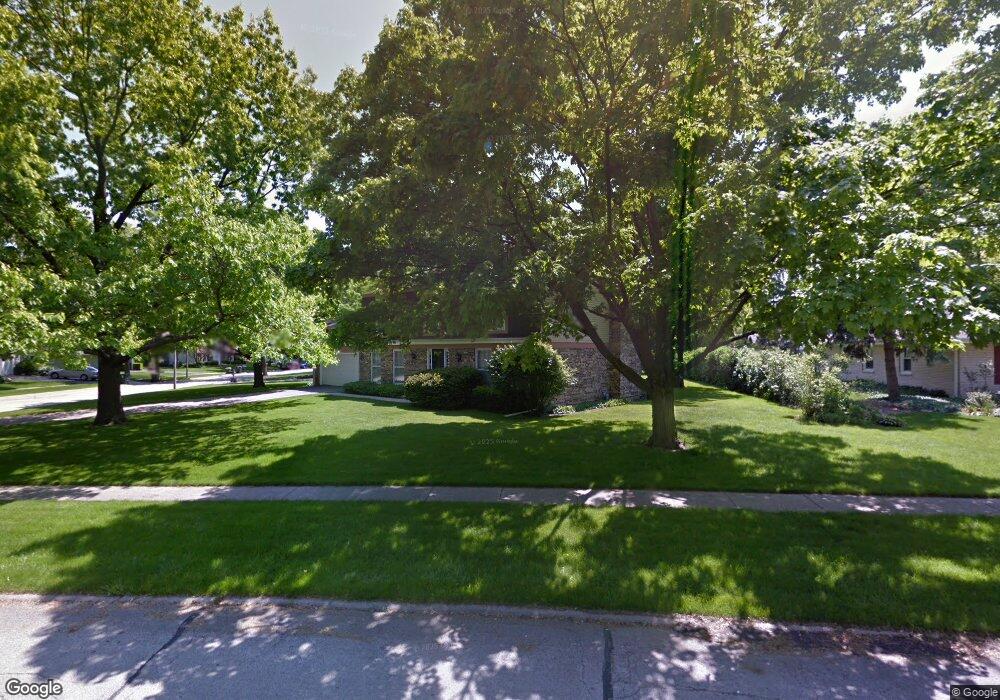
1207 Saint James Place Libertyville, IL 60048
Estimated Value: $641,000 - $707,337
--
Bed
3
Baths
2,376
Sq Ft
$285/Sq Ft
Est. Value
About This Home
This home is located at 1207 Saint James Place, Libertyville, IL 60048 and is currently estimated at $676,334, approximately $284 per square foot. 1207 Saint James Place is a home located in Lake County with nearby schools including Butterfield School, Highland Middle School, and Libertyville High School.
Ownership History
Date
Name
Owned For
Owner Type
Purchase Details
Closed on
Nov 7, 2018
Sold by
Kaiser Emily N and Erik M Nyman Revocable Trust
Bought by
Horigan Justin P and Horigan Martine D
Current Estimated Value
Home Financials for this Owner
Home Financials are based on the most recent Mortgage that was taken out on this home.
Original Mortgage
$361,000
Outstanding Balance
$318,069
Interest Rate
4.9%
Mortgage Type
New Conventional
Estimated Equity
$358,265
Purchase Details
Closed on
Oct 9, 2014
Sold by
Nyman Erik M
Bought by
Nyman Erik M and Erik N Nyman Revocable Trust
Purchase Details
Closed on
Apr 1, 2014
Sold by
Nyman Erik M and Jean G Nyman Living Trust
Bought by
Nyman Erik M
Purchase Details
Closed on
Oct 6, 2004
Sold by
Nyman Jean G
Bought by
Nyman Jean G and Jean G Nyman Living Trust
Create a Home Valuation Report for This Property
The Home Valuation Report is an in-depth analysis detailing your home's value as well as a comparison with similar homes in the area
Home Values in the Area
Average Home Value in this Area
Purchase History
| Date | Buyer | Sale Price | Title Company |
|---|---|---|---|
| Horigan Justin P | $380,000 | Chicago Title | |
| Nyman Erik M | -- | None Available | |
| Nyman Erik M | -- | None Available | |
| Nyman Jean G | -- | -- |
Source: Public Records
Mortgage History
| Date | Status | Borrower | Loan Amount |
|---|---|---|---|
| Open | Horigan Justin P | $361,000 |
Source: Public Records
Tax History Compared to Growth
Tax History
| Year | Tax Paid | Tax Assessment Tax Assessment Total Assessment is a certain percentage of the fair market value that is determined by local assessors to be the total taxable value of land and additions on the property. | Land | Improvement |
|---|---|---|---|---|
| 2024 | $14,404 | $202,582 | $75,680 | $126,902 |
| 2023 | $10,150 | $186,850 | $69,803 | $117,047 |
| 2022 | $10,150 | $132,918 | $74,547 | $58,371 |
| 2021 | $9,770 | $130,056 | $72,942 | $57,114 |
| 2020 | $9,401 | $127,870 | $71,716 | $56,154 |
| 2019 | $9,168 | $126,654 | $71,034 | $55,620 |
| 2018 | $12,055 | $170,111 | $77,692 | $92,419 |
| 2017 | $11,888 | $164,740 | $75,239 | $89,501 |
| 2016 | $11,494 | $156,196 | $71,337 | $84,859 |
| 2015 | $11,391 | $145,991 | $66,676 | $79,315 |
| 2014 | $11,055 | $144,032 | $65,781 | $78,251 |
| 2012 | $10,276 | $145,282 | $66,352 | $78,930 |
Source: Public Records
Map
Nearby Homes
- 832 Interlaken Ln
- 223 Kenloch Ave
- 1330 W Park Ave
- 1338 Trinity Place
- 1137 Pine Tree Ln
- 20924 & 20902 W Park Ave
- 694 Parkside Ct
- 662 Parkside Ct
- 551 W Park Ave Unit E
- 619 Parkside Ct
- 1512 Sunnyview Rd
- 616 Parkside Ct
- 420 W Cook Ave
- 505 Lange Ct
- 533 Drake St
- 212 W Ellis Ave
- 212 Elm Ct
- 423 Ames St
- 208 W Ellis Ave
- 204 W Ellis Ave
- 1207 St James Place
- 1219 Saint James Place
- 649 Hillcrest Dr
- 1212 Saint James Place
- 706 Hillcrest Dr
- 1231 Saint James Place
- 658 Hillcrest Dr
- 716 Hillcrest Dr
- 639 Hillcrest Dr
- 640 Ridgewood Ln
- 650 Ridgewood Ln
- 650 Hillcrest Dr
- 1228 Saint James Place
- 729 Hillcrest Dr
- 726 Hillcrest Dr
- 1243 Saint James Place
- 629 Hillcrest Dr
- 701 Sedgwick Dr
- 642 Hillcrest Dr
- 709 Sedgwick Dr