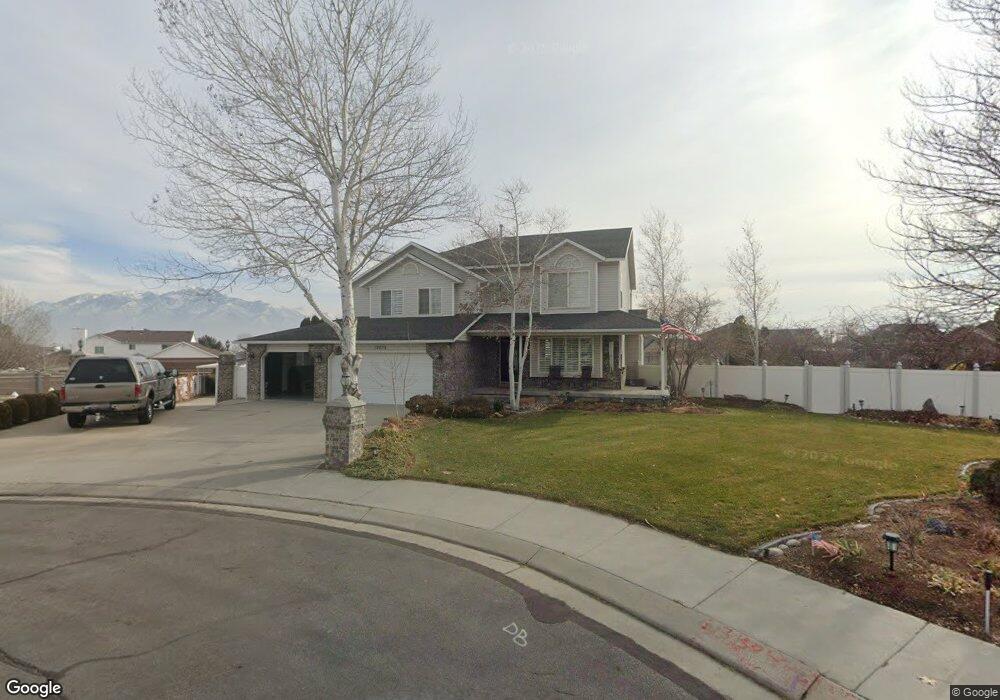
12079 Kenmore Cir Riverton, UT 84065
Estimated Value: $820,000 - $908,113
4
Beds
3
Baths
2,279
Sq Ft
$376/Sq Ft
Est. Value
About This Home
This home is located at 12079 Kenmore Cir, Riverton, UT 84065 and is currently estimated at $857,778, approximately $376 per square foot. 12079 Kenmore Cir is a home located in Salt Lake County with nearby schools including Rose Creek School, Oquirrh Hills Middle School, and Riverton High School.
Ownership History
Date
Name
Owned For
Owner Type
Purchase Details
Closed on
Dec 11, 2020
Sold by
Rackley Teresa
Bought by
Rackley Tony
Current Estimated Value
Home Financials for this Owner
Home Financials are based on the most recent Mortgage that was taken out on this home.
Original Mortgage
$292,400
Outstanding Balance
$260,323
Interest Rate
2.7%
Mortgage Type
New Conventional
Estimated Equity
$597,455
Purchase Details
Closed on
Dec 29, 2016
Sold by
Rackley Tony and Rackley Teresa
Bought by
Rackley Tony K and Rackley Teresa T
Purchase Details
Closed on
Feb 24, 2016
Sold by
Allred Todd J and Allred Karen H
Bought by
Rackley Tony and Rackley Teresa
Purchase Details
Closed on
Aug 30, 1996
Sold by
Ron Thorne Construction Inc
Bought by
Allred Todd J and Allred Karen H
Home Financials for this Owner
Home Financials are based on the most recent Mortgage that was taken out on this home.
Original Mortgage
$147,500
Interest Rate
8.2%
Create a Home Valuation Report for This Property
The Home Valuation Report is an in-depth analysis detailing your home's value as well as a comparison with similar homes in the area
Home Values in the Area
Average Home Value in this Area
Purchase History
| Date | Buyer | Sale Price | Title Company |
|---|---|---|---|
| Rackley Tony | -- | First American Title | |
| Rackley Tony | -- | First American Title | |
| Rackley Tony K | -- | None Available | |
| Rackley Tony | -- | Backman Title Services | |
| Rackley Tony | -- | Backman Title Services | |
| Allred Todd J | -- | -- |
Source: Public Records
Mortgage History
| Date | Status | Borrower | Loan Amount |
|---|---|---|---|
| Open | Rackley Tony | $292,400 | |
| Previous Owner | Allred Todd J | $147,500 |
Source: Public Records
Tax History Compared to Growth
Tax History
| Year | Tax Paid | Tax Assessment Tax Assessment Total Assessment is a certain percentage of the fair market value that is determined by local assessors to be the total taxable value of land and additions on the property. | Land | Improvement |
|---|---|---|---|---|
| 2025 | $4,299 | $774,500 | $329,700 | $444,800 |
| 2024 | $4,299 | $744,100 | $299,200 | $444,900 |
| 2023 | $4,620 | $753,900 | $296,300 | $457,600 |
| 2022 | $4,685 | $749,900 | $290,500 | $459,400 |
| 2021 | $3,976 | $566,700 | $188,400 | $378,300 |
| 2020 | $3,845 | $510,900 | $188,400 | $322,500 |
| 2019 | $3,831 | $500,400 | $188,400 | $312,000 |
| 2018 | $3,556 | $457,300 | $175,800 | $281,500 |
| 2017 | $3,325 | $395,000 | $175,800 | $219,200 |
| 2016 | $2,557 | $307,500 | $175,800 | $131,700 |
| 2015 | $2,625 | $306,100 | $174,200 | $131,900 |
| 2014 | $2,519 | $288,000 | $165,800 | $122,200 |
Source: Public Records
Map
Nearby Homes
- 12191 S 3600 W
- 12243 Janice Dr
- 3644 W Harvest Gold Way
- 11881 S Harvest Gold Way
- 3636 W Harvest Gold Way
- 3622 W Harvest Gold Way
- 11817 S 3700 W
- 3376 W Water Crescent Place
- 3371 W Waterbridge Cove Unit 417
- 12580 S Janice Dr
- 2853 W 12075 S
- 4091 W Swensen Farm Dr
- 4056 W Sullivan Rd
- 3312 W Country Bluff Rd
- 3407 W Pazos Cir Unit 4
- 11293 S Sweet Pea Ln
- 11716 S 2610 W
- 12906 Verona Creek Way
- 11287 S Winter Bluff Ln
- 2732 W Lizzi Cove
- 12079 S Kenmore Cir
- 12069 Kenmore Cir
- 12069 S Kenmore Cir
- 3482 W Harvestwood Ln
- 3498 W 12125 S
- 12082 Kenmore Cir
- 12082 Janice Dr
- 3466 W Harvestwood Ln
- 12092 Janice Dr
- 3516 W 12125 S
- 12066 Kenmore Cir
- 12047 Kenmore Cir
- 12047 S Kenmore Cir
- 3465 Jameson Ave
- 3448 Harvestwood Ln
- 1407 W Gerald Way
- 3448 W Harvestwood Ln
- 3532 W 12125 S
- 12046 Kenmore Cir
- 12046 S Kenmore Cir