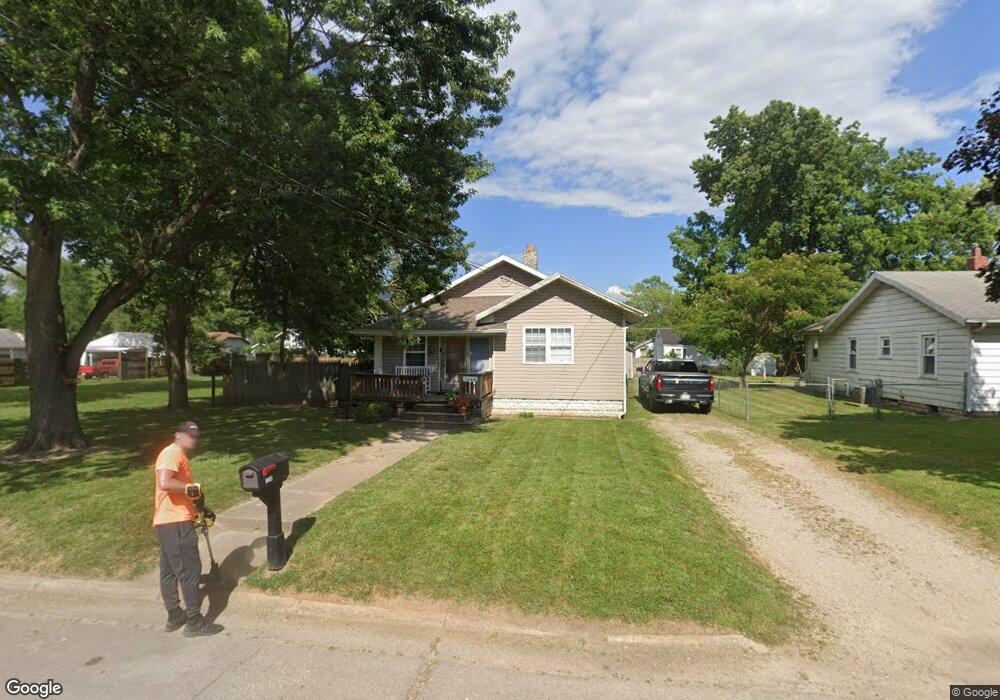
1208 S Ribble Ave Muncie, IN 47302
Blaine NeighborhoodEstimated Value: $87,000 - $105,000
2
Beds
1
Bath
952
Sq Ft
$101/Sq Ft
Est. Value
About This Home
This home is located at 1208 S Ribble Ave, Muncie, IN 47302 and is currently estimated at $96,068, approximately $100 per square foot. 1208 S Ribble Ave is a home located in Delaware County with nearby schools including South View Elementary School, Muncie Central High School, and Southside Middle School.
Ownership History
Date
Name
Owned For
Owner Type
Purchase Details
Closed on
Jan 26, 2015
Sold by
Monis Samuel F and Wright Kathrvine S
Bought by
Wright Kathervine
Current Estimated Value
Purchase Details
Closed on
Jul 27, 2010
Sold by
Secretary Of Housing & Urban Development
Bought by
Morris Samuel F and Wright Katherine S
Purchase Details
Closed on
Aug 28, 2009
Sold by
Slaven Randi N
Bought by
Gmac Mortgage Llc
Purchase Details
Closed on
Aug 26, 2009
Sold by
Gmac Mortgage Llc
Bought by
Secretary Of Housing & Urban Development
Purchase Details
Closed on
Mar 10, 2005
Sold by
Mader Gary J and Mader Susan C
Bought by
Slaven Randi N
Home Financials for this Owner
Home Financials are based on the most recent Mortgage that was taken out on this home.
Original Mortgage
$57,486
Interest Rate
6.33%
Mortgage Type
FHA
Create a Home Valuation Report for This Property
The Home Valuation Report is an in-depth analysis detailing your home's value as well as a comparison with similar homes in the area
Home Values in the Area
Average Home Value in this Area
Purchase History
| Date | Buyer | Sale Price | Title Company |
|---|---|---|---|
| Wright Kathervine | -- | -- | |
| Morris Samuel F | -- | None Available | |
| Gmac Mortgage Llc | $66,603 | None Available | |
| Secretary Of Housing & Urban Development | -- | None Available | |
| Slaven Randi N | -- | None Available |
Source: Public Records
Mortgage History
| Date | Status | Borrower | Loan Amount |
|---|---|---|---|
| Previous Owner | Slaven Randi N | $57,486 |
Source: Public Records
Tax History Compared to Growth
Tax History
| Year | Tax Paid | Tax Assessment Tax Assessment Total Assessment is a certain percentage of the fair market value that is determined by local assessors to be the total taxable value of land and additions on the property. | Land | Improvement |
|---|---|---|---|---|
| 2024 | $294 | $65,400 | $8,200 | $57,200 |
| 2023 | $594 | $55,100 | $7,500 | $47,600 |
| 2022 | $108 | $51,300 | $7,500 | $43,800 |
| 2021 | $108 | $43,000 | $6,500 | $36,500 |
| 2020 | $108 | $39,200 | $4,400 | $34,800 |
| 2019 | $108 | $40,900 | $7,300 | $33,600 |
| 2018 | $162 | $43,500 | $7,300 | $36,200 |
| 2017 | $108 | $42,800 | $6,900 | $35,900 |
| 2016 | $108 | $42,800 | $6,900 | $35,900 |
| 2014 | $43 | $42,900 | $6,900 | $36,000 |
| 2013 | -- | $42,400 | $6,900 | $35,500 |
Source: Public Records
Map
Nearby Homes
- 1118 S Walling Ave
- 1407 S Meeker Ave
- 1511 S Meeker Ave
- 1401 S Emerson Ct
- 1202 S Shipley St
- 1304 S Shipley St
- 1303 S Shipley St
- 1238 S Burlington Dr
- 707 S Luick Ave
- 2612 E Memorial Dr
- 1700 E 13th St
- 1224 S Beacon St
- 2304 S Meeker Ave
- 1801 E 16th St
- 103 S Delawanda Ave
- 2022 S Waldemere Ave
- 1806 E 18th St
- 1328 E Main St
- 107 N Delawanda Ave
- 1320 E Main St
- 1210 S Ribble Ave
- 1206 S Ribble Ave
- 1207 S Luick Ave
- 1300 S Ribble Ave
- 1204 S Ribble Ave
- 1209 S Luick Ave
- 1209 S Ribble Ave
- 1207 S Ribble Ave
- 1205 S Luick Ave
- 1301 S Luick Ave
- 1304 S Ribble Ave
- 1205 S Ribble Ave
- 1305 S Luick Ave
- 1301 S Ribble Ave
- 1203 S Luick Ave
- 1203 S Ribble Ave
- 1303 S Luick Ave
- 1200 S Ribble Ave
- 1303 S Ribble Ave
- 1306 S Ribble Ave