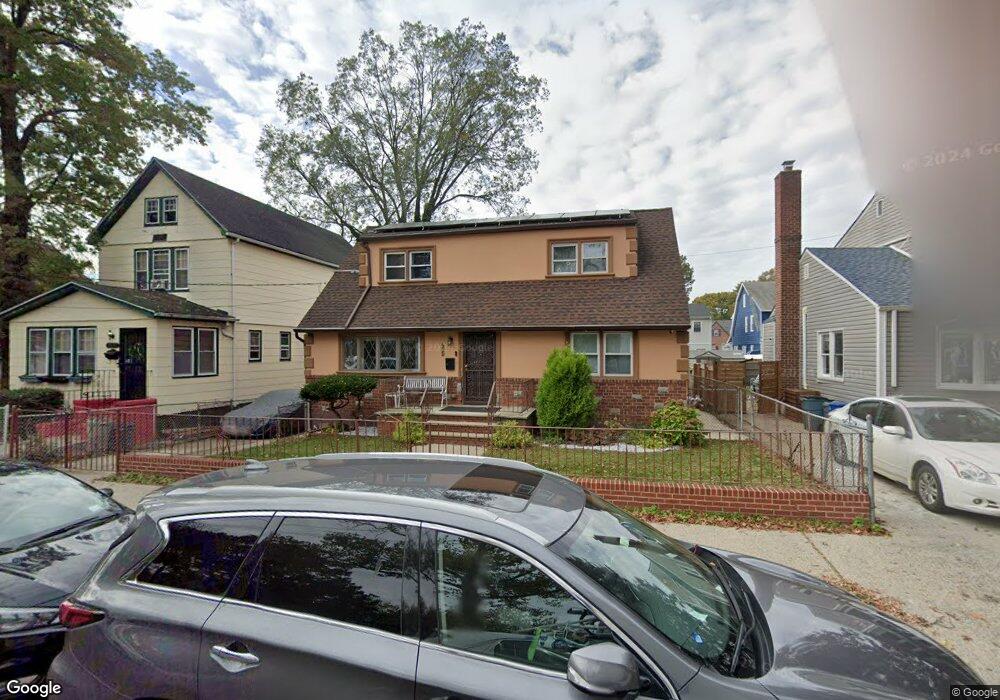
121-22 Lucas St Springfield Gardens, NY 11413
Saint Albans NeighborhoodEstimated Value: $737,000 - $849,000
4
Beds
3
Baths
1,463
Sq Ft
$539/Sq Ft
Est. Value
About This Home
This home is located at 121-22 Lucas St, Springfield Gardens, NY 11413 and is currently estimated at $789,148, approximately $539 per square foot. 121-22 Lucas St is a home located in Queens County with nearby schools including P.S. 15 Jackie Robinson, Is 59 Springfield Gardens, and Success Academy Springfield Gardens.
Ownership History
Date
Name
Owned For
Owner Type
Purchase Details
Closed on
Sep 28, 2017
Sold by
Rious Harold
Bought by
Fields Steve and Nurse Curtis
Current Estimated Value
Home Financials for this Owner
Home Financials are based on the most recent Mortgage that was taken out on this home.
Original Mortgage
$432,000
Outstanding Balance
$360,842
Interest Rate
3.82%
Mortgage Type
Purchase Money Mortgage
Estimated Equity
$428,306
Purchase Details
Closed on
Feb 3, 2011
Sold by
Holtzclaw Irrevocable Family Trust
Bought by
Rious Harold
Home Financials for this Owner
Home Financials are based on the most recent Mortgage that was taken out on this home.
Original Mortgage
$356,526
Interest Rate
4.77%
Purchase Details
Closed on
Dec 22, 2010
Sold by
Holtzclaw Doretha M
Bought by
Holtzclaw Irrevocable Trust
Home Financials for this Owner
Home Financials are based on the most recent Mortgage that was taken out on this home.
Original Mortgage
$356,526
Interest Rate
4.77%
Create a Home Valuation Report for This Property
The Home Valuation Report is an in-depth analysis detailing your home's value as well as a comparison with similar homes in the area
Home Values in the Area
Average Home Value in this Area
Purchase History
| Date | Buyer | Sale Price | Title Company |
|---|---|---|---|
| Fields Steve | $480,000 | -- | |
| Rious Harold | $365,500 | -- | |
| Holtzclaw Irrevocable Trust | -- | -- |
Source: Public Records
Mortgage History
| Date | Status | Borrower | Loan Amount |
|---|---|---|---|
| Open | Fields Steve | $432,000 | |
| Previous Owner | Rious Harold | $356,526 |
Source: Public Records
Tax History Compared to Growth
Tax History
| Year | Tax Paid | Tax Assessment Tax Assessment Total Assessment is a certain percentage of the fair market value that is determined by local assessors to be the total taxable value of land and additions on the property. | Land | Improvement |
|---|---|---|---|---|
| 2025 | $6,289 | $32,890 | $10,031 | $22,859 |
| 2024 | $6,289 | $31,310 | $10,352 | $20,958 |
| 2023 | $5,933 | $29,539 | $10,024 | $19,515 |
| 2022 | $4,090 | $45,300 | $14,640 | $30,660 |
| 2021 | $4,391 | $39,960 | $14,640 | $25,320 |
| 2020 | $4,328 | $35,700 | $14,640 | $21,060 |
| 2019 | $5,458 | $35,700 | $14,640 | $21,060 |
| 2018 | $5,018 | $24,616 | $13,839 | $10,777 |
| 2017 | $4,434 | $23,223 | $12,481 | $10,742 |
| 2016 | $4,333 | $23,223 | $12,481 | $10,742 |
| 2015 | $2,423 | $22,840 | $13,941 | $8,899 |
| 2014 | $2,423 | $21,744 | $15,345 | $6,399 |
Source: Public Records
Map
Nearby Homes
- 191-07 121st Ave
- 12133 Grayson St
- 188-51 120th Rd
- 19009 122nd Ave
- 120-44 192nd St
- 191-01 122nd Ave
- 12054 194th St
- 12248 Benton St
- 119-44 193rd St
- 12251 Grayson St
- 120-20 194th St
- 12253 Milburn St
- 18822 119th Ave
- 12043 194th St
- 122-22 Nellis St
- 194-09 122nd Ave
- 18806 Nashville Blvd
- 19115 Williamson Ave
- 11915 193rd St
- 12244 Nellis St
- 12114 Lucas St
- 12116 Lucas St
- 19020 121st Ave
- 190-16 121st Ave
- 190-16 121st Ave Unit 2nd FL
- 19016 121st Ave
- 19016 121st Ave Unit 2nd FL
- 19020 121st Ave
- 12122 Lucas St
- 190-10 121st Ave
- 19010 121st Ave
- 12111 Benton St
- 12115 Benton St
- 12119 Benton St
- 19006 121st Ave
- 12128 Lucas St
- 12115 Lucas St
- 19002 121st Ave
- 12123 Benton St
- 12127 Benton St