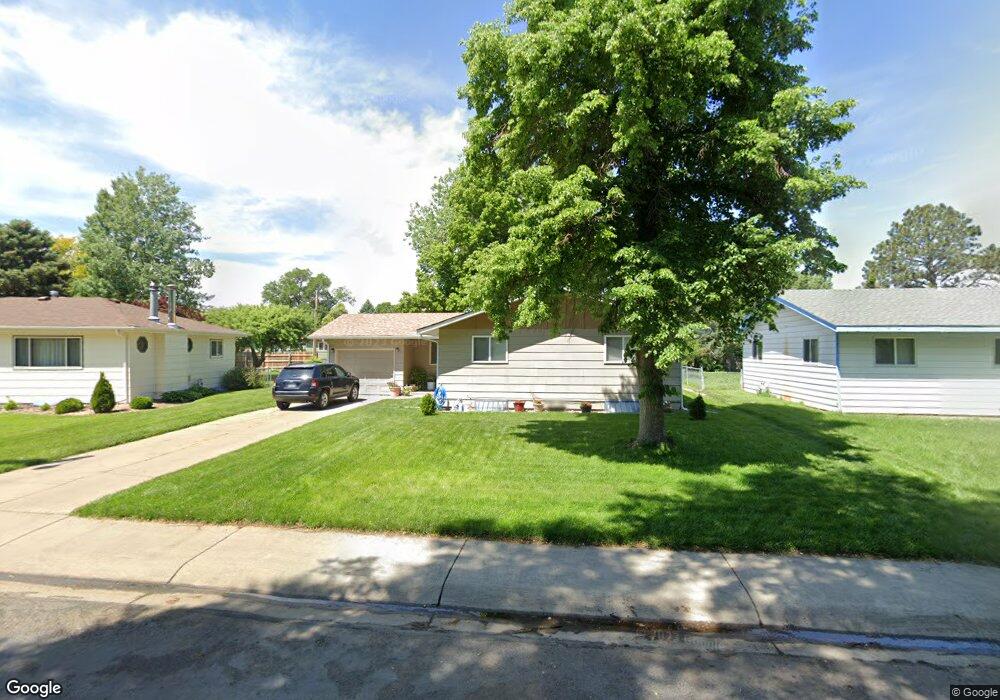
121 Cherry St Fort Morgan, CO 80701
Estimated Value: $323,416 - $360,000
4
Beds
2
Baths
2,240
Sq Ft
$152/Sq Ft
Est. Value
About This Home
This home is located at 121 Cherry St, Fort Morgan, CO 80701 and is currently estimated at $340,104, approximately $151 per square foot. 121 Cherry St is a home located in Morgan County with nearby schools including Fort Morgan High School and Lighthouse Seventh-day Adventist Christian School.
Ownership History
Date
Name
Owned For
Owner Type
Purchase Details
Closed on
Nov 12, 2021
Sold by
Jaquez Cosme Flores and Flores Esperanza
Bought by
Jaquez Rosme Flores and Flores Esperanza
Current Estimated Value
Purchase Details
Closed on
Aug 9, 2018
Sold by
Jaquez Cosme Flores
Bought by
Jaquez Cosme Flores and Flores Esperanza
Purchase Details
Closed on
Jun 29, 2018
Sold by
Navezz Jose Jn
Bought by
Naquin Cosme Floves
Purchase Details
Closed on
Oct 31, 2006
Sold by
Weimer Elmira
Bought by
Flores Nevarez Jose and Flores Jaquez Cosme
Home Financials for this Owner
Home Financials are based on the most recent Mortgage that was taken out on this home.
Original Mortgage
$147,682
Interest Rate
6.26%
Mortgage Type
FHA
Create a Home Valuation Report for This Property
The Home Valuation Report is an in-depth analysis detailing your home's value as well as a comparison with similar homes in the area
Home Values in the Area
Average Home Value in this Area
Purchase History
| Date | Buyer | Sale Price | Title Company |
|---|---|---|---|
| Jaquez Rosme Flores | -- | None Available | |
| Jaquez Cosme Flores | -- | None Available | |
| Naquin Cosme Floves | -- | None Available | |
| Flores Nevarez Jose | $150,000 | None Available |
Source: Public Records
Mortgage History
| Date | Status | Borrower | Loan Amount |
|---|---|---|---|
| Previous Owner | Flores Nevarez Jose | $147,682 |
Source: Public Records
Tax History Compared to Growth
Tax History
| Year | Tax Paid | Tax Assessment Tax Assessment Total Assessment is a certain percentage of the fair market value that is determined by local assessors to be the total taxable value of land and additions on the property. | Land | Improvement |
|---|---|---|---|---|
| 2024 | $966 | $18,760 | $2,240 | $16,520 |
| 2023 | $966 | $22,450 | $2,680 | $19,770 |
| 2022 | $722 | $15,760 | $2,630 | $13,130 |
| 2021 | $743 | $16,200 | $2,700 | $13,500 |
| 2020 | $646 | $14,810 | $2,570 | $12,240 |
| 2019 | $647 | $14,810 | $2,570 | $12,240 |
| 2018 | $997 | $11,630 | $2,140 | $9,490 |
| 2017 | $998 | $11,630 | $2,140 | $9,490 |
| 2016 | $951 | $10,980 | $2,580 | $8,400 |
| 2015 | $937 | $10,980 | $2,580 | $8,400 |
| 2014 | $880 | $10,060 | $2,290 | $7,770 |
| 2013 | -- | $10,060 | $2,290 | $7,770 |
Source: Public Records
Map
Nearby Homes