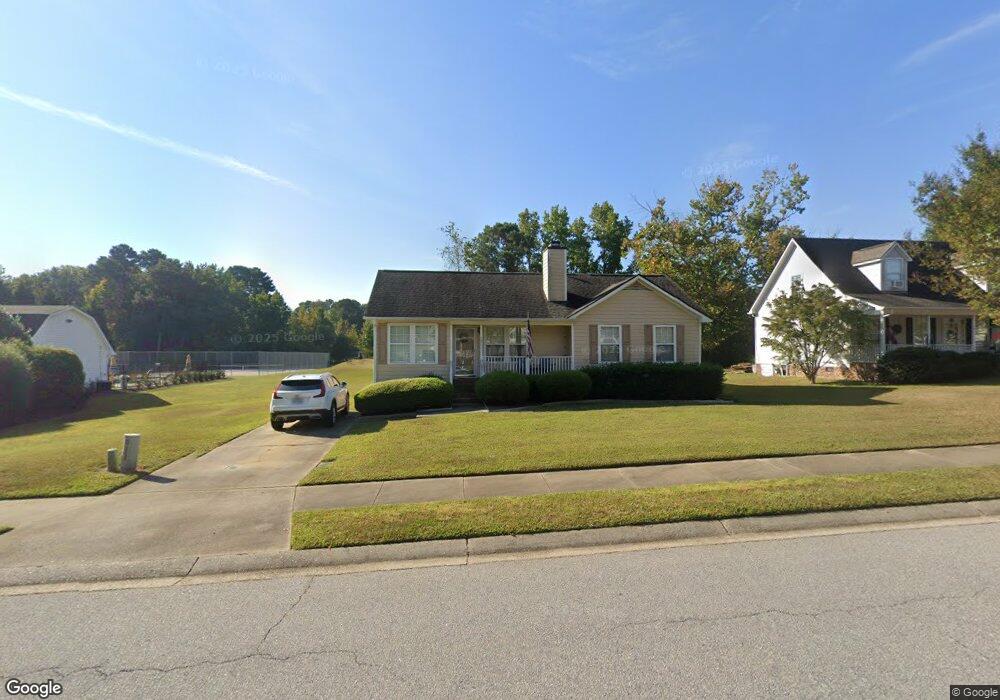
121 Teal Lake Dr Holly Springs, NC 27540
Estimated Value: $334,000 - $360,000
3
Beds
2
Baths
1,140
Sq Ft
$300/Sq Ft
Est. Value
About This Home
This home is located at 121 Teal Lake Dr, Holly Springs, NC 27540 and is currently estimated at $342,493, approximately $300 per square foot. 121 Teal Lake Dr is a home located in Wake County with nearby schools including Fuquay-Varina High, Southern Wake Academy, and Thales Academy Holly Springs Pre-K-8.
Ownership History
Date
Name
Owned For
Owner Type
Purchase Details
Closed on
Nov 30, 2018
Sold by
Weber William and The Acer Wood Revocable Trust
Bought by
The Red Barron Properties Llc
Current Estimated Value
Home Financials for this Owner
Home Financials are based on the most recent Mortgage that was taken out on this home.
Original Mortgage
$162,750
Outstanding Balance
$143,386
Interest Rate
4.8%
Mortgage Type
New Conventional
Estimated Equity
$199,107
Purchase Details
Closed on
May 9, 2005
Sold by
Hougom Larry D
Bought by
Weber William
Purchase Details
Closed on
May 26, 2000
Sold by
Davis Matthew C
Bought by
Hougom Larry D
Home Financials for this Owner
Home Financials are based on the most recent Mortgage that was taken out on this home.
Original Mortgage
$118,218
Interest Rate
8.14%
Mortgage Type
VA
Create a Home Valuation Report for This Property
The Home Valuation Report is an in-depth analysis detailing your home's value as well as a comparison with similar homes in the area
Home Values in the Area
Average Home Value in this Area
Purchase History
| Date | Buyer | Sale Price | Title Company |
|---|---|---|---|
| The Red Barron Properties Llc | -- | None Available | |
| Red Barron Properties Llc | -- | None Listed On Document | |
| Weber William | $97,000 | -- | |
| Hougom Larry D | $116,000 | -- |
Source: Public Records
Mortgage History
| Date | Status | Borrower | Loan Amount |
|---|---|---|---|
| Open | Red Barron Properties Llc | $162,750 | |
| Closed | Red Barron Properties Llc | $162,750 | |
| Previous Owner | Hougom Larry D | $118,218 |
Source: Public Records
Tax History Compared to Growth
Tax History
| Year | Tax Paid | Tax Assessment Tax Assessment Total Assessment is a certain percentage of the fair market value that is determined by local assessors to be the total taxable value of land and additions on the property. | Land | Improvement |
|---|---|---|---|---|
| 2025 | $2,709 | $312,412 | $120,000 | $192,412 |
| 2024 | $2,697 | $312,412 | $120,000 | $192,412 |
| 2023 | $2,155 | $197,924 | $68,000 | $129,924 |
| 2022 | $2,081 | $197,924 | $68,000 | $129,924 |
| 2021 | $2,042 | $197,924 | $68,000 | $129,924 |
| 2020 | $2,042 | $197,924 | $68,000 | $129,924 |
| 2019 | $1,815 | $149,167 | $50,000 | $99,167 |
| 2018 | $1,641 | $149,167 | $50,000 | $99,167 |
| 2017 | $1,583 | $149,167 | $50,000 | $99,167 |
| 2016 | $1,561 | $149,167 | $50,000 | $99,167 |
| 2015 | $1,529 | $143,802 | $48,000 | $95,802 |
| 2014 | $1,477 | $143,802 | $48,000 | $95,802 |
Source: Public Records
Map
Nearby Homes
- 437 Hidden Cellars Dr
- 501 Hidden Cellars Dr
- 408 Teal Lake Dr
- 141 Spring Pine Ln
- 2027 Hayes Ln
- 517 Hidden Cellars Dr
- 108 Hidden Farm Ln
- 616 Wildwood Farm Way
- 4014 Kentworth Dr
- 617 Wildwood Farm Way
- 225 Seneca Shore Dr
- 500 Eno Dr
- 2511 Dalmahoy Ln
- 308 E Maple Ave
- 705 Morton Farm Rd
- 2622 Perthshire Ln
- 4600 Alhambra Place
- 717 Utley St
- 2404 Girvan Dr
- 201 Jasper Point Dr
- 117 Teal Lake Dr
- 113 Teal Lake Dr
- 124 Teal Lake Dr
- 120 Teal Lake Dr
- 128 Teal Lake Dr
- 109 Teal Lake Dr
- 132 Teal Lake Dr
- 401 Hidden Cellars Dr
- 116 Teal Lake Dr
- 212 Weathervane Way
- 112 Teal Lake Dr
- 405 Hidden Cellars Dr
- 136 Teal Lake Dr
- 105 Teal Lake Dr
- 209 Weathervane Way
- 108 Teal Lake Dr
- 409 Hidden Cellars Dr
- 101 Barbwire Cir
- 208 Weathervane Way
- 400 Hidden Cellars Dr