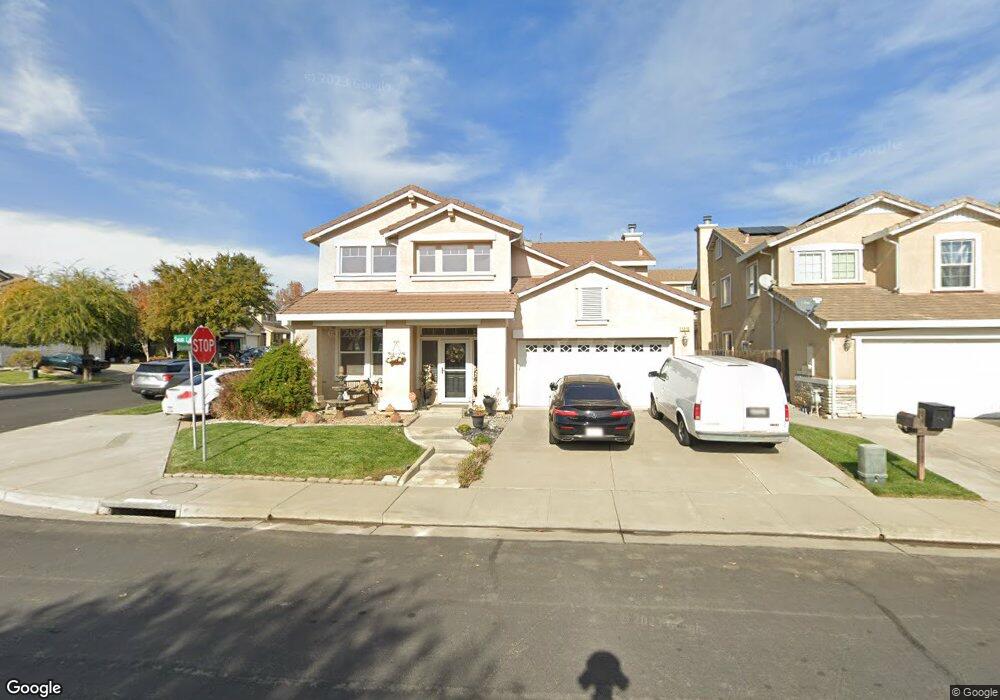
1210 Swan Lake Dr Fairfield, CA 94533
Estimated Value: $647,068 - $677,000
3
Beds
3
Baths
2,285
Sq Ft
$291/Sq Ft
Est. Value
About This Home
This home is located at 1210 Swan Lake Dr, Fairfield, CA 94533 and is currently estimated at $664,767, approximately $290 per square foot. 1210 Swan Lake Dr is a home located in Solano County with nearby schools including Laurel Creek Elementary School, Grange Middle School, and Fairfield High School.
Ownership History
Date
Name
Owned For
Owner Type
Purchase Details
Closed on
Mar 15, 2007
Sold by
Rowzee Patrick L and Boyle Tammy
Bought by
Boyle Tammy A
Current Estimated Value
Purchase Details
Closed on
Sep 16, 2005
Sold by
Boyle Tammy
Bought by
Boyle Tammy and Rowzee Patrick L
Home Financials for this Owner
Home Financials are based on the most recent Mortgage that was taken out on this home.
Original Mortgage
$418,000
Outstanding Balance
$153,469
Interest Rate
1%
Mortgage Type
Negative Amortization
Estimated Equity
$511,298
Purchase Details
Closed on
Sep 13, 2002
Sold by
Woodlake Lp
Bought by
Rowzee Patrick L and Boyle Tammy
Home Financials for this Owner
Home Financials are based on the most recent Mortgage that was taken out on this home.
Original Mortgage
$293,117
Interest Rate
7.3%
Create a Home Valuation Report for This Property
The Home Valuation Report is an in-depth analysis detailing your home's value as well as a comparison with similar homes in the area
Home Values in the Area
Average Home Value in this Area
Purchase History
| Date | Buyer | Sale Price | Title Company |
|---|---|---|---|
| Boyle Tammy A | -- | None Available | |
| Boyle Tammy | -- | Chicago Title Co | |
| Boyle Tammy | $187,000 | Chicago Title Co | |
| Rowzee Patrick L | $326,000 | -- |
Source: Public Records
Mortgage History
| Date | Status | Borrower | Loan Amount |
|---|---|---|---|
| Open | Boyle Tammy | $418,000 | |
| Previous Owner | Rowzee Patrick L | $293,117 | |
| Closed | Rowzee Patrick L | $16,285 |
Source: Public Records
Tax History Compared to Growth
Tax History
| Year | Tax Paid | Tax Assessment Tax Assessment Total Assessment is a certain percentage of the fair market value that is determined by local assessors to be the total taxable value of land and additions on the property. | Land | Improvement |
|---|---|---|---|---|
| 2025 | $6,680 | $471,707 | $144,825 | $326,882 |
| 2024 | $6,680 | $462,459 | $141,986 | $320,473 |
| 2023 | $7,494 | $453,392 | $139,202 | $314,190 |
| 2022 | $7,352 | $444,503 | $136,473 | $308,030 |
| 2021 | $7,250 | $435,789 | $133,798 | $301,991 |
| 2020 | $7,113 | $431,322 | $132,427 | $298,895 |
| 2019 | $6,970 | $422,866 | $129,831 | $293,035 |
| 2018 | $6,179 | $414,576 | $127,286 | $287,290 |
| 2017 | $5,952 | $406,448 | $124,791 | $281,657 |
| 2016 | $5,919 | $398,480 | $122,345 | $276,135 |
| 2015 | $5,538 | $386,000 | $112,000 | $274,000 |
| 2014 | $5,338 | $364,000 | $106,000 | $258,000 |
Source: Public Records
Map
Nearby Homes
- 1249 Shoreline Cir
- 3233 Lagunita Cir
- 2855 Candleberry Way
- 2856 Rebecca Dr
- 3121 Muse Way
- 3826 Danbury Way
- 2825 Regatta Cir
- 1031 Suffolk Way
- 3045 Balance Cir
- 1401 Jamboree Dr
- 1336 Jamboree Dr
- 1336 Renewal Ln
- 1508 Millennium Way
- 1512 Millennium Way
- 1516 Millennium Way
- 2784 Ambrosia Way
- 1532 Millennium Way
- 2915 Shaver St
- 2538 Aspire Way
- 1540 Millennium Way
- 1214 Swan Lake Dr
- 1209 Shoreline Cir
- 1218 Swan Lake Dr
- 1213 Shoreline Cir
- 1217 Shoreline Cir
- 2977 Shoreline Cir
- 2985 Shoreline Cir
- 1209 Swan Lake Dr
- 2973 Shoreline Cir
- 1222 Swan Lake Dr
- 1213 Swan Lake Dr
- 2981 Shoreline Cir
- 1221 Shoreline Cir
- 2969 Shoreline Cir
- 1217 Swan Lake Dr
- 2989 Shoreline Cir
- 1226 Swan Lake Dr
- 2965 Shoreline Cir
- 1225 Shoreline Cir
- 1221 Swan Lake Dr