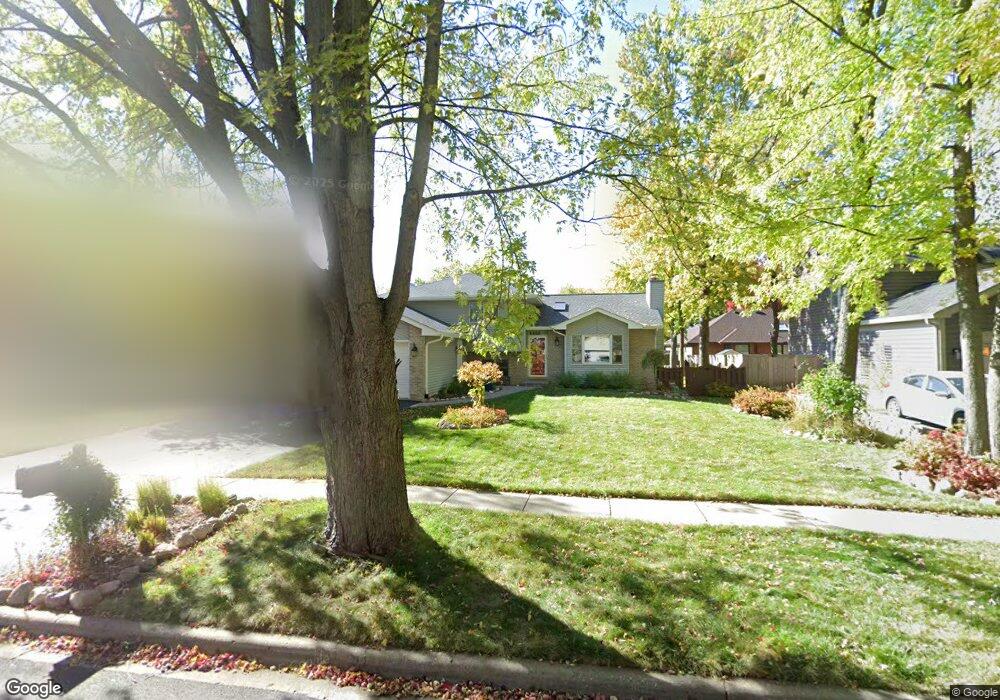
1210 Wood Dr Woodstock, IL 60098
Estimated Value: $311,000 - $341,000
3
Beds
3
Baths
1,377
Sq Ft
$238/Sq Ft
Est. Value
About This Home
This home is located at 1210 Wood Dr, Woodstock, IL 60098 and is currently estimated at $328,234, approximately $238 per square foot. 1210 Wood Dr is a home located in McHenry County with nearby schools including Dean Street Elementary School, Creekside Middle School, and Woodstock High School.
Ownership History
Date
Name
Owned For
Owner Type
Purchase Details
Closed on
Jan 28, 2000
Sold by
Hill Michael D and Hill Nicolette J
Bought by
Nilsson Eric and Nilsson Sandra
Current Estimated Value
Home Financials for this Owner
Home Financials are based on the most recent Mortgage that was taken out on this home.
Original Mortgage
$135,000
Interest Rate
7.98%
Purchase Details
Closed on
Feb 27, 1998
Sold by
Harwell Charley Mark and Harwell Irene B
Bought by
Hill Michael D and Hill Nicolette J
Home Financials for this Owner
Home Financials are based on the most recent Mortgage that was taken out on this home.
Original Mortgage
$157,225
Interest Rate
7.08%
Purchase Details
Closed on
Sep 21, 1995
Sold by
Ellett Ronald A
Bought by
Harwell Charley Mark and Harwell Irene B
Home Financials for this Owner
Home Financials are based on the most recent Mortgage that was taken out on this home.
Original Mortgage
$100,000
Interest Rate
7.78%
Create a Home Valuation Report for This Property
The Home Valuation Report is an in-depth analysis detailing your home's value as well as a comparison with similar homes in the area
Home Values in the Area
Average Home Value in this Area
Purchase History
| Date | Buyer | Sale Price | Title Company |
|---|---|---|---|
| Nilsson Eric | $175,000 | -- | |
| Hill Michael D | $165,500 | Land Title Group | |
| Harwell Charley Mark | $160,500 | Chicago Title Insurance Co |
Source: Public Records
Mortgage History
| Date | Status | Borrower | Loan Amount |
|---|---|---|---|
| Closed | Nilsson Eric | $135,000 | |
| Previous Owner | Hill Michael D | $157,225 | |
| Previous Owner | Harwell Charley Mark | $100,000 |
Source: Public Records
Tax History Compared to Growth
Tax History
| Year | Tax Paid | Tax Assessment Tax Assessment Total Assessment is a certain percentage of the fair market value that is determined by local assessors to be the total taxable value of land and additions on the property. | Land | Improvement |
|---|---|---|---|---|
| 2024 | $8,387 | $99,025 | $12,463 | $86,562 |
| 2023 | $7,978 | $89,551 | $11,271 | $78,280 |
| 2022 | $7,575 | $79,474 | $10,003 | $69,471 |
| 2021 | $7,203 | $74,254 | $9,346 | $64,908 |
| 2020 | $7,307 | $74,009 | $8,881 | $65,128 |
| 2019 | $7,092 | $70,646 | $8,477 | $62,169 |
| 2018 | $6,456 | $63,921 | $9,669 | $54,252 |
| 2017 | $6,649 | $62,848 | $9,100 | $53,748 |
| 2016 | $6,587 | $58,193 | $8,426 | $49,767 |
| 2013 | -- | $50,662 | $6,930 | $43,732 |
Source: Public Records
Map
Nearby Homes
- 1380 Sandpiper Ln
- 908 Bunker St
- 155 Lee Ann Ln
- 331 Chestnut St
- 421 W Kimball Ave
- 601 S Jefferson St
- 104 Stewart Ave
- 125 Forest Ave
- 2007 Edgewood Dr
- 415 Dean St
- 434 Lake Ave
- 330 Lake Ave
- 9999 E Calhoun St
- 1288 Prairie Ridge Trail
- 3848 Riverwoods Dr
- 3902 Riverwoods Dr
- 3842 Riverwoods Dr
- 3839 Riverwoods Dr
- Townsend Plan at Clublands of Antioch - Horizon Series
- Napa Plan at Clublands of Antioch - Andare Series
- 1220 Wood Dr Unit 1
- 1200 Wood Dr
- 1217 Portage Ln
- 1207 Portage Ln
- 1227 Portage Ln
- 1230 Wood Dr
- 1211 Wood Dr
- 1221 Wood Dr
- 1201 Wood Dr
- 1237 Portage Ln
- 1240 Wood Dr
- 431 Barbary Ln
- 441 Barbary Ln
- 521 Blue Bonnet Ln
- 421 Barbary Ln
- 1247 Portage Ln Unit 3
- 518 Barbary Ln
- 1241 Wood Dr
- 1210 Portage Ln
- 501 Barbary Ln