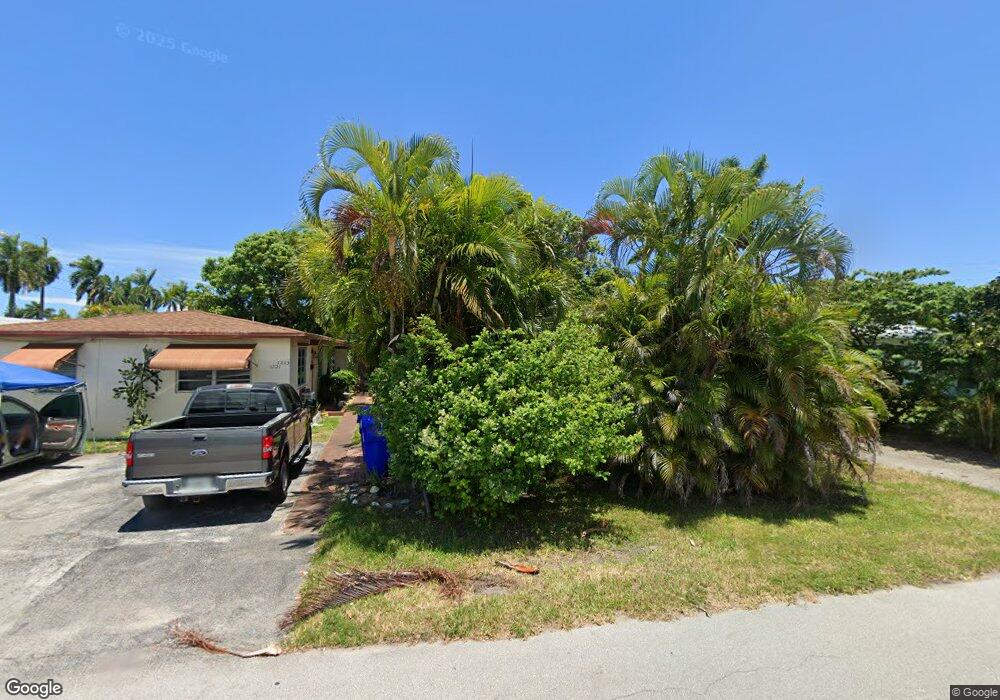
1211 N 16th Ave Hollywood, FL 33020
Hollywood Lakes NeighborhoodEstimated Value: $480,000 - $647,000
2
Beds
2
Baths
1,382
Sq Ft
$400/Sq Ft
Est. Value
About This Home
This home is located at 1211 N 16th Ave, Hollywood, FL 33020 and is currently estimated at $553,400, approximately $400 per square foot. 1211 N 16th Ave is a home located in Broward County with nearby schools including Hollywood Central Elementary School, Olsen Middle School, and South Broward High School.
Ownership History
Date
Name
Owned For
Owner Type
Purchase Details
Closed on
Oct 20, 2020
Sold by
Ionita Calin Ion
Bought by
Ciurdar Joseph and Ciurdar Rebecca
Current Estimated Value
Home Financials for this Owner
Home Financials are based on the most recent Mortgage that was taken out on this home.
Original Mortgage
$274,928
Outstanding Balance
$244,088
Interest Rate
2.8%
Mortgage Type
FHA
Estimated Equity
$309,312
Purchase Details
Closed on
Apr 27, 2015
Sold by
Ionita Jon
Bought by
Ionita Calin Ion
Purchase Details
Closed on
Jan 26, 2012
Sold by
Hanuschak Anna
Bought by
Ionita Jon
Purchase Details
Closed on
Apr 6, 2009
Sold by
Sandrie R M
Bought by
Ionita Jon D and Hanuschak Anna
Purchase Details
Closed on
Apr 25, 2001
Sold by
Jon D Ionita I
Bought by
Sandrie R M
Purchase Details
Closed on
Oct 22, 1998
Sold by
Duris Michael
Bought by
Ionita Jon D and Hanschak Anna
Purchase Details
Closed on
Mar 1, 1990
Sold by
Available Not
Bought by
Available Not
Create a Home Valuation Report for This Property
The Home Valuation Report is an in-depth analysis detailing your home's value as well as a comparison with similar homes in the area
Home Values in the Area
Average Home Value in this Area
Purchase History
| Date | Buyer | Sale Price | Title Company |
|---|---|---|---|
| Ciurdar Joseph | $280,000 | Title Solutions Agency Llc | |
| Ionita Calin Ion | -- | None Available | |
| Ionita Jon | -- | Attorney | |
| Ionita Jon D | -- | None Available | |
| Sandrie R M | $129,000 | -- | |
| Ionita Jon D | $82,000 | -- | |
| Available Not | $7,857 | -- |
Source: Public Records
Mortgage History
| Date | Status | Borrower | Loan Amount |
|---|---|---|---|
| Open | Ciurdar Joseph | $274,928 |
Source: Public Records
Tax History Compared to Growth
Tax History
| Year | Tax Paid | Tax Assessment Tax Assessment Total Assessment is a certain percentage of the fair market value that is determined by local assessors to be the total taxable value of land and additions on the property. | Land | Improvement |
|---|---|---|---|---|
| 2025 | $5,867 | $314,830 | -- | -- |
| 2024 | $5,708 | $305,960 | -- | -- |
| 2023 | $5,708 | $297,050 | $0 | $0 |
| 2022 | $5,410 | $288,400 | $0 | $0 |
| 2021 | $5,268 | $280,000 | $69,060 | $210,940 |
| 2020 | $7,635 | $350,360 | $69,060 | $281,300 |
| 2019 | $7,502 | $339,510 | $69,120 | $270,390 |
| 2018 | $6,956 | $321,850 | $69,120 | $252,730 |
| 2017 | $6,462 | $298,740 | $0 | $0 |
| 2016 | $6,188 | $279,800 | $0 | $0 |
| 2015 | $2,498 | $162,060 | $0 | $0 |
| 2014 | $2,500 | $160,780 | $0 | $0 |
| 2013 | -- | $183,810 | $69,120 | $114,690 |
Source: Public Records
Map
Nearby Homes
- 1201 N 16th Ave
- 1231 N 15th Ct
- 1511 Garfield St
- 1507 Garfield St
- 1231 N 16th Ct
- 1510 Hayes St
- 1628 Arthur St
- 1010 N 16th Ave
- 1501 Arthur St Unit 10
- 1501 Arthur St Unit 1
- 1501 Arthur St Unit 9
- 1501 Arthur St Unit 3
- 1501 Arthur St Unit 7
- 1636 Arthur St
- 1639 Hayes St
- 1123 N 17th Ave
- 1427 Garfield St
- 1325 N 15th Ave
- 924-926 N 16th Ave
- 1520 Mckinley St Unit 216E
- 1207 N 16th Ave
- 1221 N 16th Ave
- 1546 Arthur St Unit 2
- 1546 Arthur St Unit 1A
- 1546 Arthur St
- 1543 Garfield St
- 1539 Garfield St
- 1535 Garfield St
- 1207 N 15th Ct
- 1200 N 15th Ct
- 1220 N 15th Ct
- 1214 N 15th Ct Unit FRONT
- 1214 N 15th Ct
- 1214 N 15th Ct
- 1224 N 15th Ct
- 1531 Garfield St
- 1544 Arthur St Unit 1
- 1544 Arthur St
- 1544 Arthur St Unit 2
- 1600 Arthur St