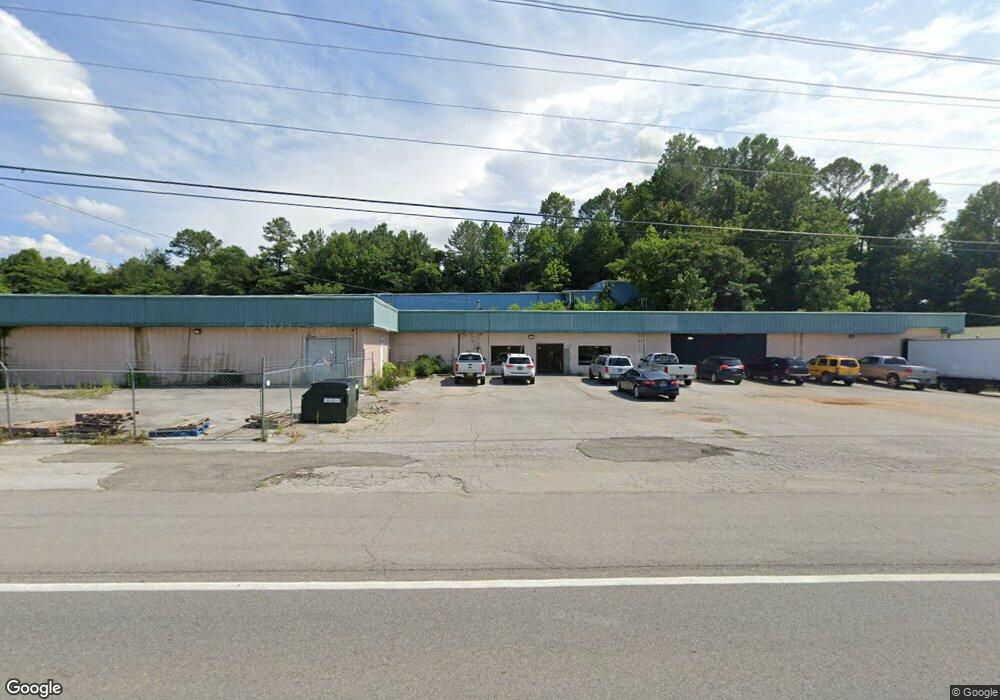
1211 W Gaines St Lawrenceburg, TN 38464
Estimated Value: $464,127
--
Bed
1
Bath
6,000
Sq Ft
$77/Sq Ft
Est. Value
About This Home
This home is located at 1211 W Gaines St, Lawrenceburg, TN 38464 and is currently estimated at $464,127, approximately $77 per square foot. 1211 W Gaines St is a home located in Lawrence County with nearby schools including David Crockett Elementary School, Ingram Sowell Elementary School, and Lawrenceburg Public Elementary School.
Ownership History
Date
Name
Owned For
Owner Type
Purchase Details
Closed on
Aug 16, 2024
Sold by
Sir Edward Llc
Bought by
Sir Edward Llc
Current Estimated Value
Home Financials for this Owner
Home Financials are based on the most recent Mortgage that was taken out on this home.
Original Mortgage
$62,500
Outstanding Balance
$61,795
Interest Rate
6.89%
Mortgage Type
Credit Line Revolving
Estimated Equity
$402,332
Purchase Details
Closed on
Jun 21, 2022
Sold by
George Vrailas
Bought by
Sir Edward Llc
Purchase Details
Closed on
Dec 6, 2021
Sold by
Perry Gary E and Perry Cynthia
Bought by
Vrailas George
Purchase Details
Closed on
Feb 21, 2006
Sold by
Smith Kenneth W
Bought by
Perry Gary E
Home Financials for this Owner
Home Financials are based on the most recent Mortgage that was taken out on this home.
Original Mortgage
$160,000
Interest Rate
6.05%
Mortgage Type
Commercial
Purchase Details
Closed on
Mar 7, 1973
Bought by
Bobs Surplus Sales
Create a Home Valuation Report for This Property
The Home Valuation Report is an in-depth analysis detailing your home's value as well as a comparison with similar homes in the area
Home Values in the Area
Average Home Value in this Area
Purchase History
| Date | Buyer | Sale Price | Title Company |
|---|---|---|---|
| Sir Edward Llc | -- | None Listed On Document | |
| Sir Edward Llc | $400,000 | Plant Paul B | |
| Vrailas George | $225,000 | None Available | |
| Perry Gary E | $170,000 | -- | |
| Bobs Surplus Sales | -- | -- |
Source: Public Records
Mortgage History
| Date | Status | Borrower | Loan Amount |
|---|---|---|---|
| Open | Sir Edward Llc | $62,500 | |
| Previous Owner | Bobs Surplus Sales | $160,000 |
Source: Public Records
Tax History Compared to Growth
Tax History
| Year | Tax Paid | Tax Assessment Tax Assessment Total Assessment is a certain percentage of the fair market value that is determined by local assessors to be the total taxable value of land and additions on the property. | Land | Improvement |
|---|---|---|---|---|
| 2025 | $2,774 | $89,240 | $0 | $0 |
| 2024 | $2,774 | $89,240 | $16,400 | $72,840 |
| 2023 | $2,774 | $89,240 | $16,400 | $72,840 |
| 2022 | $2,774 | $89,240 | $16,400 | $72,840 |
| 2021 | $2,919 | $66,400 | $16,400 | $50,000 |
| 2020 | $2,919 | $66,400 | $16,400 | $50,000 |
| 2019 | $2,919 | $66,400 | $16,400 | $50,000 |
| 2018 | $2,919 | $66,400 | $16,400 | $50,000 |
| 2017 | $2,919 | $66,400 | $16,400 | $50,000 |
| 2016 | $2,919 | $66,400 | $16,400 | $50,000 |
| 2015 | $2,764 | $66,400 | $16,400 | $50,000 |
| 2014 | $2,779 | $66,760 | $16,400 | $50,360 |
Source: Public Records
Map
Nearby Homes
- 845 Gaither Ave
- 108 Buffalo Rd
- 330 Cocke St
- 234 Glenn Springs Rd
- 219 Waterloo St
- 113 W Taylor St
- 426 Frank St
- 0 W Point Rd Unit RTC2942707
- 222 Groh St
- 316 S Military Ave
- 209 Frank St
- 310 May St
- 213 Pulaski St
- 409 N Military Ave
- 0 Stewart St
- 511 S Locust Ave
- 802 Mahr Ave
- 215 Depot St
- 109 Fairway Dr
- 0 Woodland Dr Unit RTC2772580
- 1225 W Gaines St
- 1219 W Gaines St
- 1213 W Gaines St Unit A
- 1213 W Gaines St Unit B
- 1209 W Gaines St
- 1210 Marion Dr
- 1220 Marion Dr
- 50401 Old Waynesboro Hwy
- 1207 Marion Dr
- 1260 Marion Dr
- 1270 Marion Dr
- 1205 Marion Dr
- 1215 Marion Dr
- 601 Reid Cir
- 585 Skyline Dr
- 594 Skyline Dr
- 1005 W Gaines St
- 603 Skyline Dr
- 1003 W Gaines St
- 604 Waterloo St